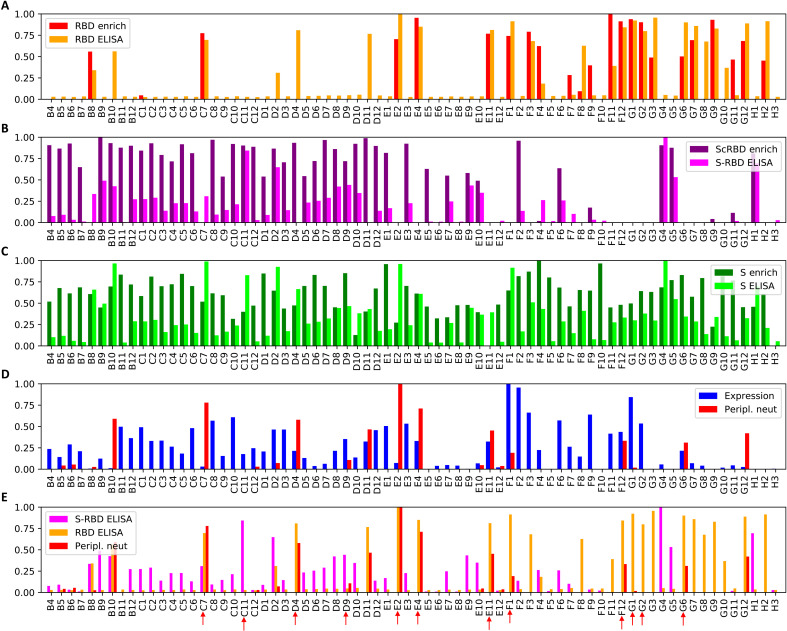
Fig. 3. Rapid nanobody screening.
Seventy-two nanobodies, selected from the multivariate analysis, were synthesized and expressed, and the crude periplasmic extract was screened for expression, binding, and neutralization. All values are normalized to the maximum value across nanobodies. Panels (A), (B), and (C) depict, for each nanobody, the enrichment calculated from the NGS data and the corresponding periplasmic extract ELISA, for RBD, ScRBD, and S, respectively. For panel (B), the S-RBD ELISA signal is the RBD optical density at 450 nm (OD450) subtracted from the S OD450 and should only be strongly positive when a nanobody binds the spike outside of the RBD. Together, panels (A) and (B) show that, for the vast majority of nanobody variants, the enrichment analysis is strongly predictive of whether the nanobody targets RBD or not. Panel (D) shows (log-domain) PSV neutralization IC50s and nanobody expression measured from the periplasmic extract. Panel (E) shows RBD ELISA, S-RBD ELISA, and PSV neutralization together, with nanobodies selected for subsequent investigation are highlighted with red arrows.

