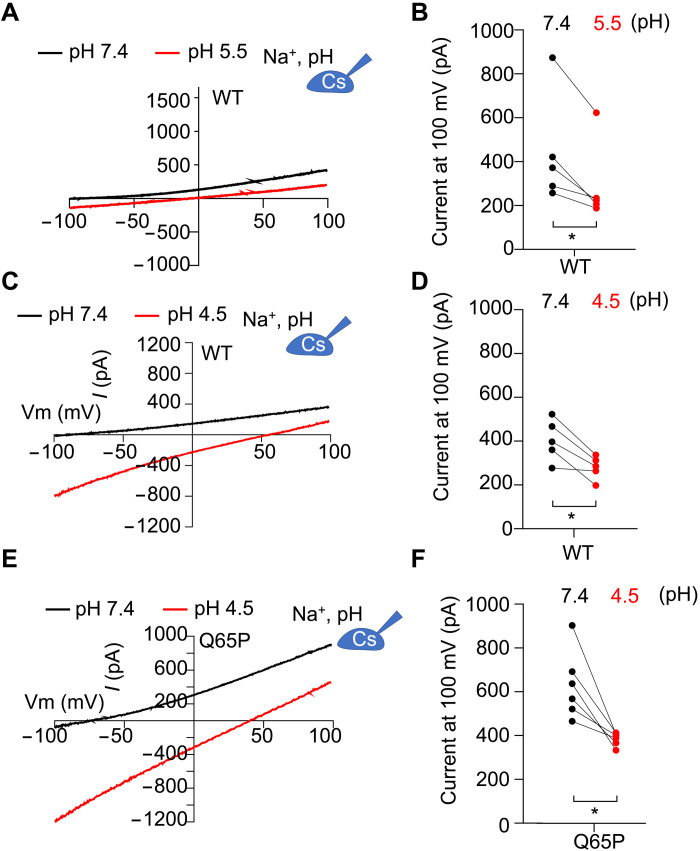
Fig. 1. K+ conductivity of human TMEM175 regulated by pH.
(A) Representative current-voltage (I-V) curves obtained in whole-cell configuration from HEK293T cells expressing hsTMEM175 WT at pH 7.4 and 5.5. (B) Averaged currents measured at either 100 or −100 mV from (A) for both hsTMEM175 WT at pH 7.4 and 5.5 (N = 5), showing the difference between pH 7.4 and pH 4.5. *P < 0.05. (C) Representative I-V curves obtained in whole-cell configuration from HEK293T cells expressing hsTMEM175 WT at pH 7.4 and pH 4.5. (D) Averaged currents measured at 100 mV from (C) for both hsTMEM175 WT at pH 7.4 and pH 4.5 (N = 5), showing the difference between pH 7.4 and pH 4.5. *P < 0.05. (E) Representative I-V curves obtained in whole-cell configuration from HEK293T cells expressing hsTMEM175 Q65P mutant at pH 7.4 and pH 4.5. (F) Averaged currents at 100 mV of hsTMEM175 Q65P at pH 7.4 and pH 4.5 (N = 5), showing the difference at pH 7.4 or pH 4.5. *P < 0.05.

