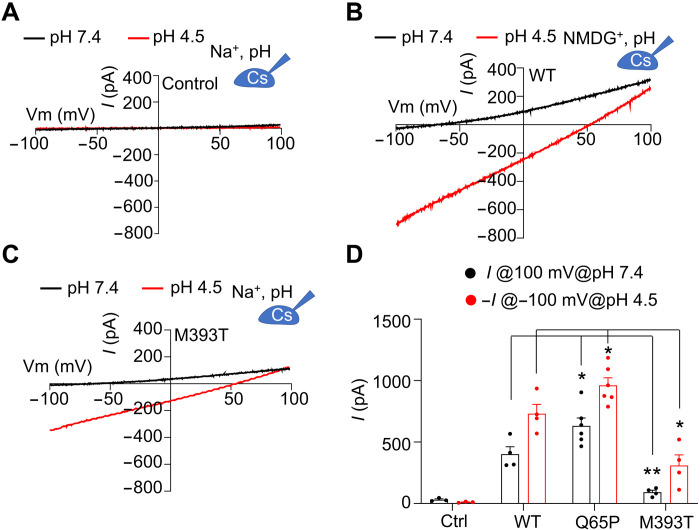
Fig. 2. Proton conductance by TMEM175 WT and PD-associated mutants.
(A) Representative I-V curves obtained in whole-cell configuration from HEK293T cells without expressing hsTMEM175 at pH 7.4 and pH 4.5. The pipette solution contains 150 mM Cs+, and 150 mM Na+ was used in the bath solution. (B) Representative I-V curves from HEK293T cells expressing WT hsTMEM175 at pH 7.4 and pH 4.5, with 150 mM NMDG+ in the bath solution. (C) Representative I-V curves obtained in whole-cell configuration from HEK293T cells expressing hsTMEM175 M393T mutant at pH 7.4 and pH 4.5. (D) Averaged currents at 100 and −100 mV of control, hsTMEM175 WT, Q65P, and M393T at pH 7.4 and pH 4.5 (N = 5), showing the difference at pH 7.4 or pH 4.5. *P < 0.05; **P < 0.01.

