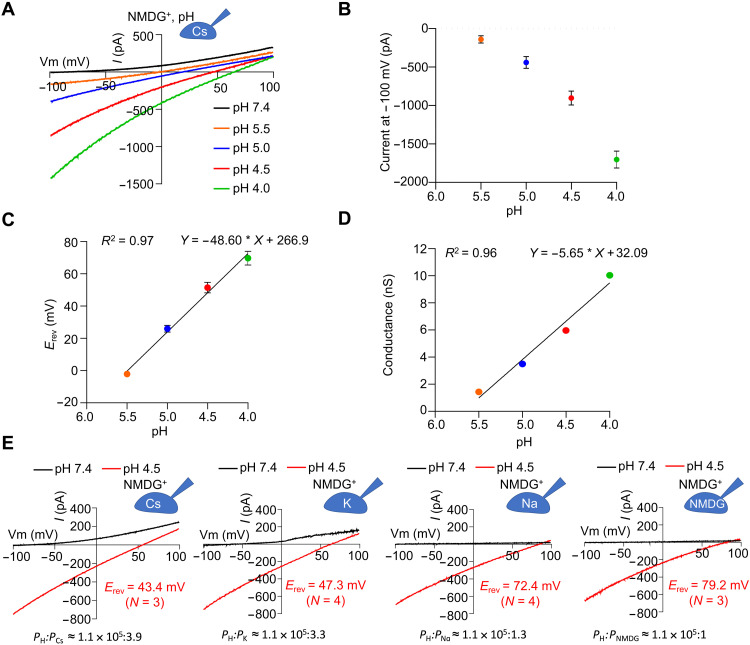
Fig. 3. Proton conductance and selectivity of human TMEM175.
(A) Representative I-V curves of hsTMEM175 WT at various pH as indicated showing the drift of the currents at −100 and +100 mV. (B) Averaged currents at −100 mV of hsTMEM175 WT from (A) as a function of pH values. Data are presented as means ± SEM for n = 4 (pH 5.5) and n = 3 (other pH). (C) Erev as a function of pH values from experiments in (A). Data are presented as means ± SEM for n = 4 (pH 5.5) and n = 3 (other pH). (D) Conductance at −100 mV as a function of pH values derived from (B) and (C). (E) Representative I-V curves of hsTMEM175 WT at pH 7.4 and pH 4.5, showing the ion selectivity for proton over potassium, sodium, cesium, and NMDG+ ions.

