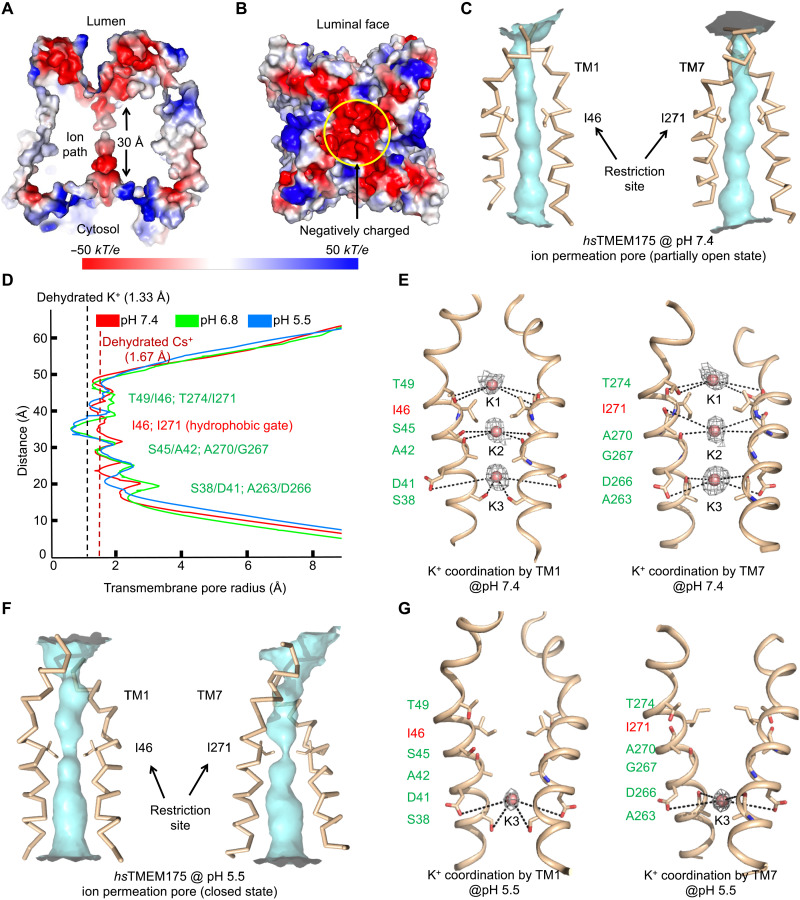
Fig. 5. Ion permeation pore of human TMEM175.
(A) Cross section through the pore showing the surface electrostatic potential of the pore and the pore entrances at the luminal and cytosolic sides (pH 6.8 structure model). (B) The surface electrostatic potential of the luminal face of the channel. (C) The ion permeation pore of hsTMEM175 at pH 7.4 formed by TM1 and TM7 with restriction residues in sticks representing an open conformation. (D) The pore radii of pH 5.5 (blue), pH 6.8 (green), and pH 7.4 (red) hsTMEM175 structures along the pore axis calculated using the HOLE program (44). The conserved gate residues are labeled in red, and residues coordinating K+ are colored in green. (E) K+ sites coordinated by hydrophilic residues lining the ion permeation pore (pH 7.4). The conserved gate residues are labeled in red, and residues coordinating the three K+ ions are labeled in green. Cryo-EM density for the K+ ions are contoured at 2.1 σ and shown in gray. (F) The ion permeation pore of hsTMEM175 at pH 5.5 formed by TM1 and TM7 with restriction residues in sticks, representing a closed conformation for K+ permeation. (G) One K+ site coordinated by hydrophilic residues lining the ion permeation pore (pH 5.5). The conserved gate residues are labeled in red, and residues coordinating the K+ site are labeled in green. Cryo-EM density for the K+ ions are contoured at 1.3 σ and shown in gray.

