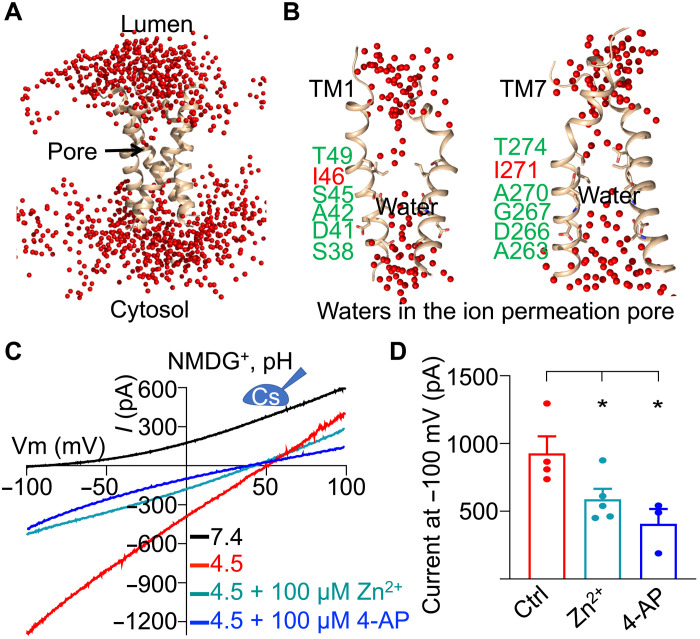
Fig. 6. Proton permeation pathway of human TMEM175.
(A) Selected water distribution in and around the hsTMEM175 structure from the molecular dynamics simulation. TM1 and TM7 of hsTMEM175 are shown in a ribbon diagram, water molecules are displayed as red spheres, and the ion permeation pore is indicated by an arrow. (B) Water molecules in the ion permeation pore of TMEM175. (C) Representative I-V curves of hsTMEM175 WT at conditions as indicated, showing the inhibition of TMEM175 conductivity by Zn2+ and 4-AP. (D) Averaged currents at −100 mV of hsTMEM175 WT from (C) at pH 4.5 in the absence and presence of 100 μM Zn2+ or 100 μM 4-AP. Data are presented as means ± SEM for n = 5.

