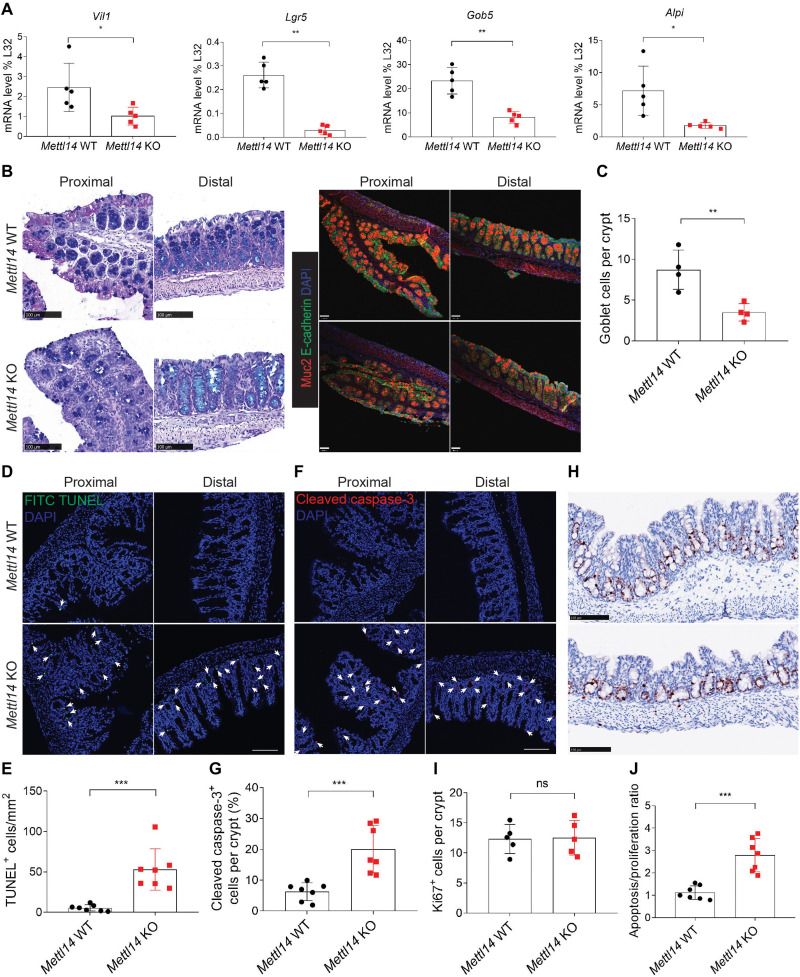
Fig. 2. Mettl14 depletion leads to colonic epithelial cell death.
(A) qRT-PCR analysis of gene expression in Mettl14 WT and Mettl14 KO mice at 2 weeks of age. Vil1, intestinal epithelial cell marker; Lgr5, intestinal stem cell marker; Gob5, goblet cell marker; Alpi, colonocyte marker (n = 4 to 5 per group). (B) Left: Representative AB-PAS–stained proximal and distal colon sections of Mettl14 WT and Mettl14 KO mice at 2 weeks of age (scale bars, 100 μm). Right: Representative Muc2 staining of proximal and distal colon sections from Mettl14 WT and Mettl14 KO mice at 2 weeks of age (scale bars, 70 μm). (C) Quantitative analysis of AB-PAS and Muc2 staining (n = 4 per group). (D and E) Representative TUNEL staining of proximal and distal colon sections from Mettl14 WT and Mettl14 KO mice at 2 weeks of age [(D), scale bar, 100 μm] and quantitative analysis [(E), n = 7 per group]. TUNEL-positive cell (arrows). (F and G) Representative cleaved caspase-3–stained proximal and distal colon sections of Mettl14 WT and Mettl14 KO mice at 2 weeks of age [(F); scale bar, 100 μm] and quantitative analysis [(G), n = 7 per group]. Cleaved caspase-3–positive cell (arrows). (H and I) Representative Ki67 staining of distal colon sections from Mettl14 WT and Mettl14 KO mice at 2 weeks of age [(H); scale bars, 100 μm] and quantitative analysis [(I), n = 5 per group]. (J) Quantitative analysis of cell apoptosis versus cell proliferation ratio (n = 7 per group). Data are presented as means ± SD. Two-sided Student’s t test (A, C, E, G, I, and J) was performed (ns, no significance; *P < 0.05; **P < 0.01; ***P < 0.001).

