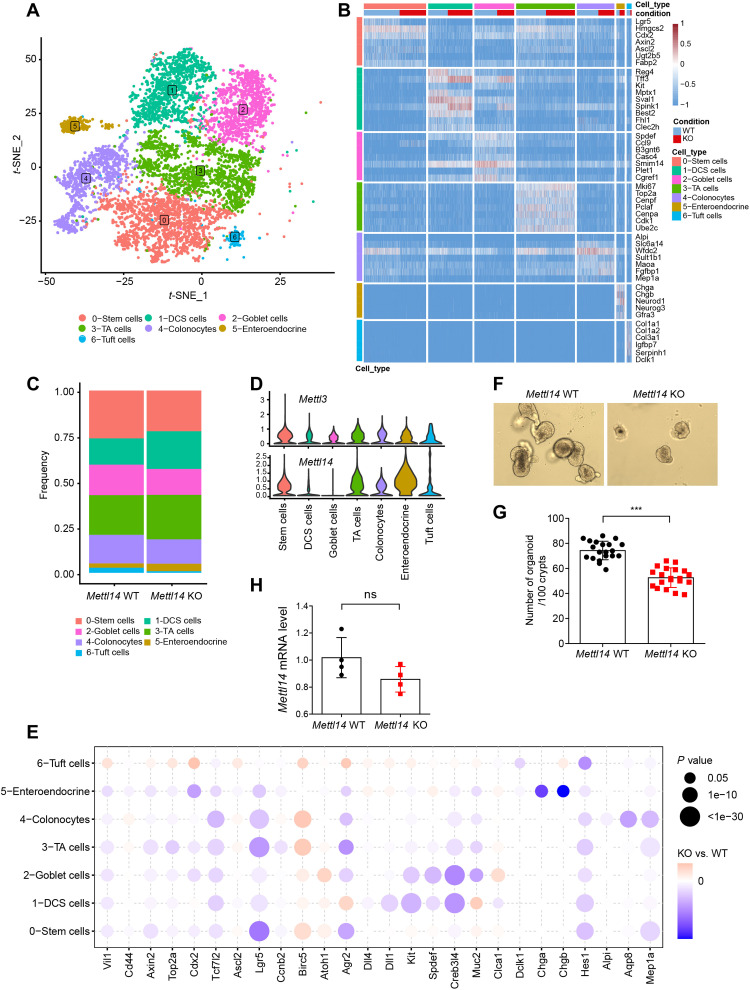
Fig. 3. scRNA-seq reveals dysfunction of colonic epithelial cells in Mettl14 KO mice.
(A) t-SNE plot of 7863 epithelial cells from Mettl14 WT and Mettl14 KO mouse colons of 2 weeks of age showing seven major clusters. (B) Gene expression heatmap of seven clusters. Rows represent signature genes, and columns represent different clusters. (C) Proportion of each epithelial cell cluster among the total epithelial cells. (D) Violin plots showing the entire range of Mettl3 and Mettl14 gene expression levels per single cell in each cluster after imputation. (E) Bubble heatmap showing expression of selected marker genes for each cluster. (F) Representative bright-field images of colonic organoids grown from Mettl14 WT and Mettl14 KO mice. (G) Organoid number per 100 crypts per well in 3D culture medium (n = 20 for each group). (H) Statistical analysis of relative levels of Mettl14 in surviving organoids from Mettl14 WT and Mettl14 KO mice (n = 4 per group). Data are presented as means ± SD. Two-sided Student’s t test (G and H) was performed (***P < 0.001).

