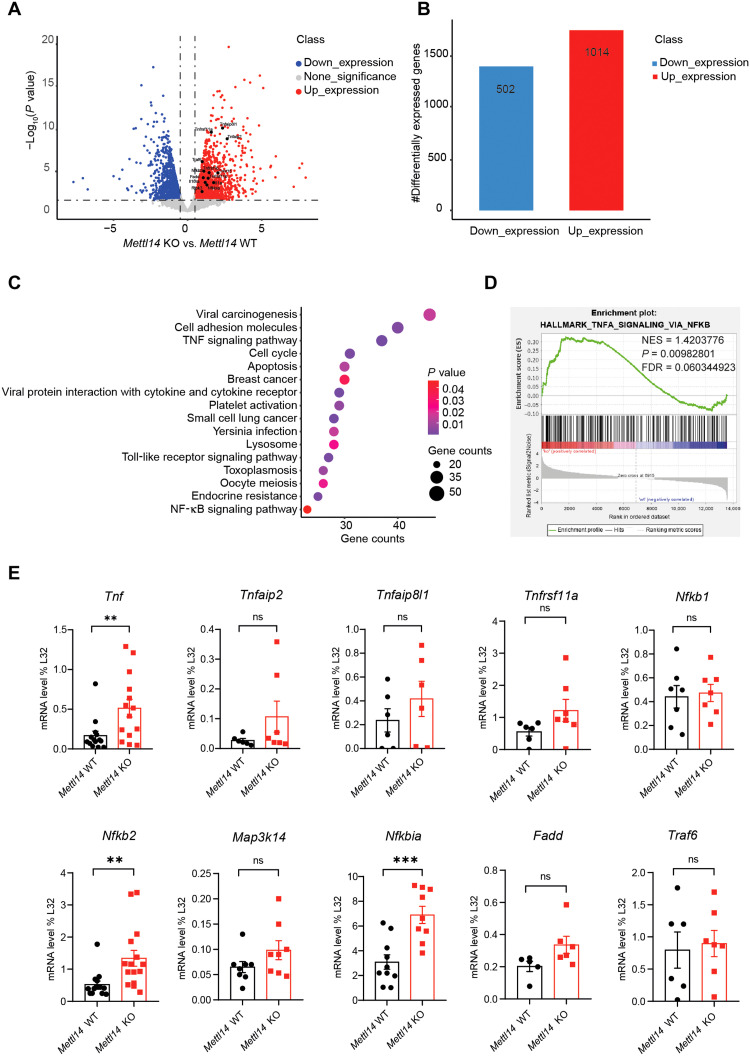
Fig. 5. m6A modification regulates colonic epithelial cell homeostasis by restricting TNF-induced cell death.
(A) Volcano plot of comparative RNA-seq data between 2-week-old Mettl14 WT and Mettl14 KO mice. The x axis specifies the log2 fold changes (FC), and the y axis specifies the −log10 P value (Mettl14 KO compared to Mettl14 WT). Blue dots represent down-regulated genes [log2(FC) ≤ −1 and P ≤ 0.05], and red dots represent up-regulated genes [log2(FC) ≥ 1 and P ≤ 0.05]. (B) Number of genes that increased significantly (red) and decreased (blue) in Mettl14 KO versus Mettl14 WT colonic epithelial cells. (C) KEGG enrichment analysis of differentially expressed genes. (D) GSEA plot determined by RNA-seq profiling. Analysis completed on genes ranked by log10 false discovery rate (FDR) and FC sign, with enrichment determined after 1000 permutations. The statistics were computed using GSEA and controlled for multiple comparisons by FDR. NES, normalized enrichment score. (E) qRT-PCR was used to verify the differentially expressed genes related to the TNF signaling pathway (n = 6 to 9 per group). Data are presented as means ± SD. Two-sided Student’s t test (E) was performed (**P < 0.01; ***P < 0.001).

