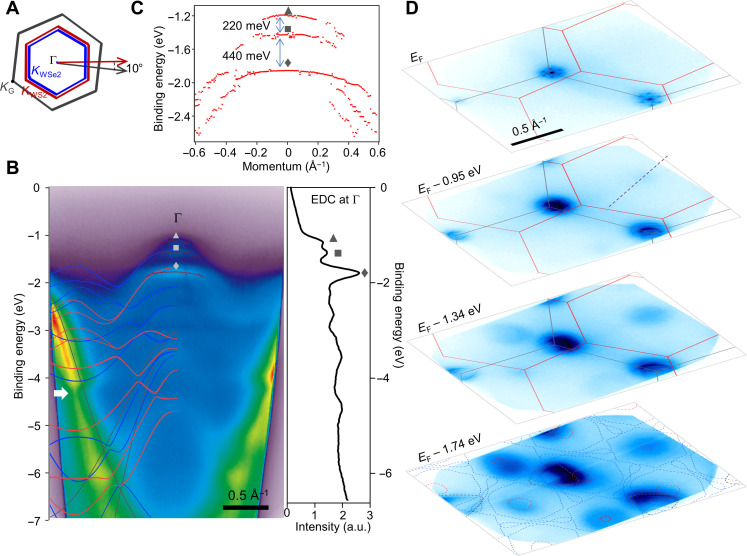
Fig. 2. Direct observation of minibands in a graphene/WS2/WSe2 moiré superlattice.
(A) Schematic of Brillouin zones of graphene (gray), WS2 (red), and WSe2 (blue). (B) An ARPES cut across Γ point along the purple dashed line shown in (D), where the left half is overlaid with the bands calculated by DFT (gray, graphene; red, WS2; blue, WSe2). Right: Energy distribution curve (EDC) taken at Γ, and the moiré bands at different increasing binding energies are labeled with a triangle, a square, and a diamond, respectively. The fitted peak positions are further indicated with red dots in the ARPES cut. a.u., arbitrary units. (C) Extracted EDC peak positions showing the large energy splittings between the three bands observed at Γ. (D) Constant energy contours at various binding energies. The gray and red lines in the top three panels indicate the Brillouin zones of graphene and WSe2, respectively. Bottom: Dashed lines show the bands produced by DFT calculations: gray for graphene, red for WS2, and blue for WSe2.

