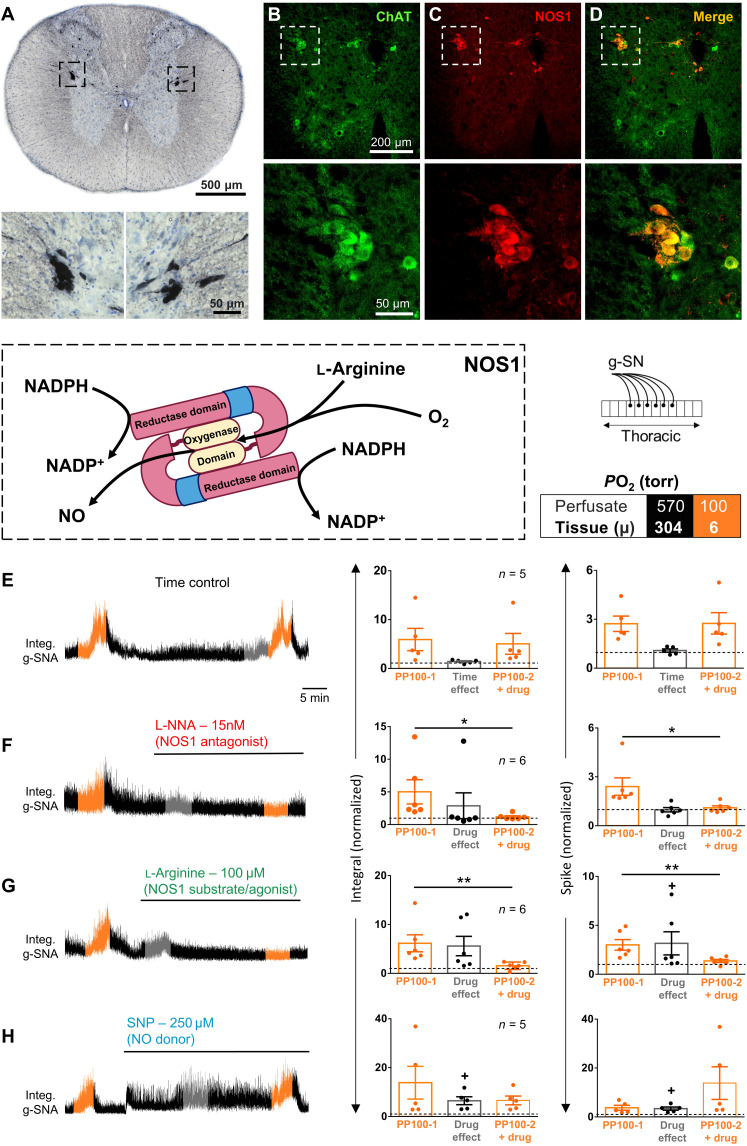
Fig. 7. Role of NOS1 in SOSs.
(A) Horseradish peroxidase immunohistochemistry for NOS1 in IML of rat thoracic spinal cord. (B and C) Double fluorescent immunohistochemistry for NOS1 (red) and ChAT (green) in mouse thoracic spinal cord. (D) Merged NOS1 and ChAT labeling. The IML (dashed squares) are magnified in the bottom panels. Note that NOS1 is expressed in all but most medial SSPNs as previously described, and the expression level may differ between SSPNs innervating different targets (84). (E to H) Box: Color-coding illustrates perfusate PO2 in torr. Left: g-SNA responses to hypoxia in rat in situ thoracic spinal cord preparations (see schematic). The hypoxic responses (perfusate and tissue PO2, 100 and ~6 torr, respectively) and drug effects were measured during the 1-min interval with the greatest response, illustrated in orange and gray, respectively. Right: Group data. (E) Time control; (F) L-NNA, NOS1 blocker; (G) l-arginine, NOS1 agonist; (H) SNP, NOS-independent NO donor. Dots show data from individual preparations; values exceeding dashed lines are greater than baseline. Bars show means ± SEM. Comparison between hypoxic responses before and with drug, *P < 0.05 and **P < 0.01; baseline effect of drug, +P < 0.05. Amplitude and/or area under the curve indicates activity level. Time scale in (E) applies to all traces. See table S2 for detailed statistics.

