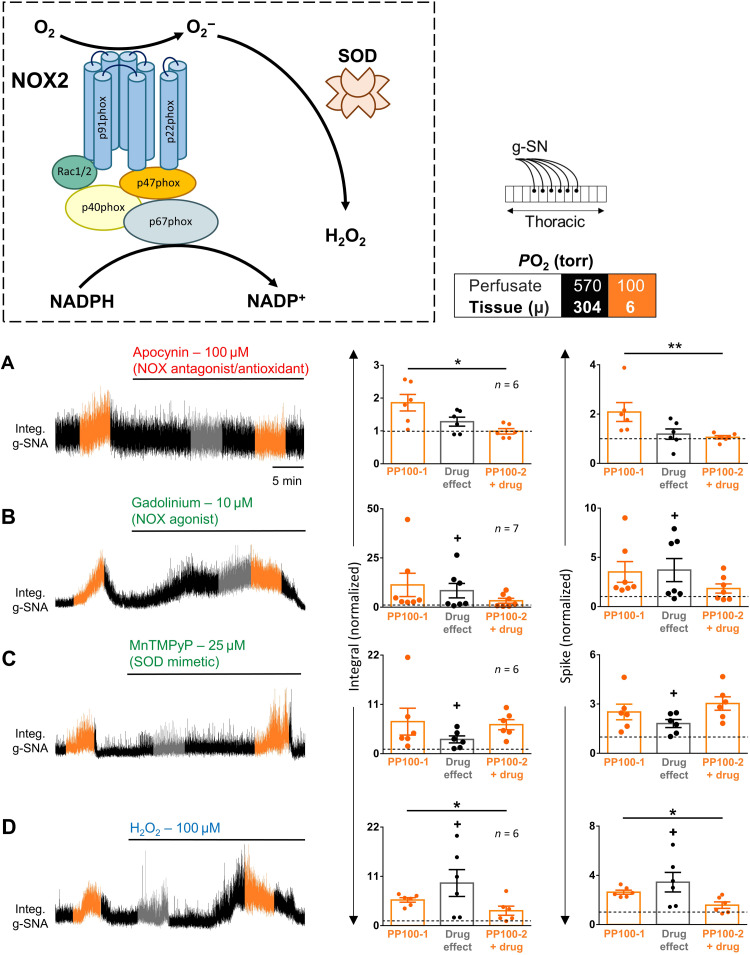
Fig. 9. Role of NOX and ROS in SOSs.
Box: Color-coding illustrates perfusate PO2 in torr. Left: g-SNA responses to hypoxia in rat in situ thoracic spinal cord preparations (see schematic). The hypoxic responses (perfusate and tissue PO2, 100 and ~6 torr, respectively) and drug effects were measured during the 1-min interval with the greatest response, illustrated in orange and gray, respectively. Right: Group data. (A) Apocynin, NOX inhibitor; (B) gadolinium, NOX agonist; (C) MnTMPyP, SOD mimetic; (D) H2O2, ROS. Dots show data from individual preparations; values exceeding dashed lines are greater than baseline. Bars show means ± SEM. Amplitude and/or area under the curve indicates activity level. Comparison between hypoxic responses before and with drug, *P < 0.05 and **P < 0.01; baseline effect of drug, +P < 0.05. Time scale in (A) applies to all traces. See table S2 for detailed statistics.

