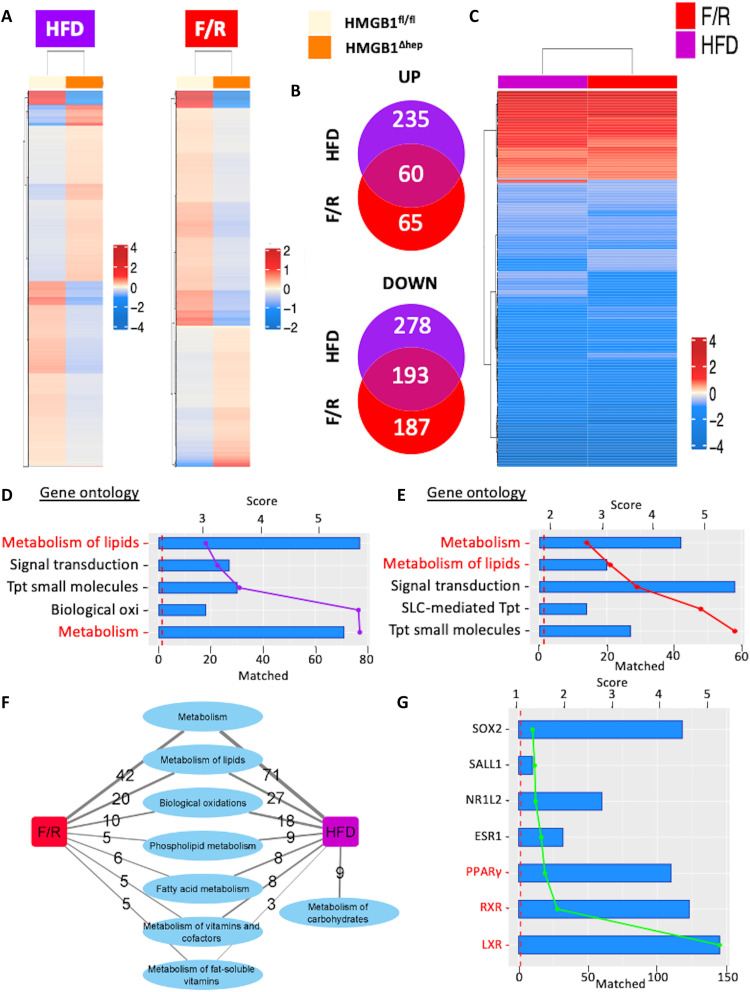
Fig. 4. Microarray analysis of hepatic gene expression profiles in HMGB1ΔHep mice.
(A) Heatmap showing genes that are differentially expressed in the livers of HMGB1ΔHep mice compared to HMGB1fl/fl mice (fold change > 1.5; P ≤ 0.01) after HFD (left) or F/R (right). Heatmaps display the mean normalized expression per genotype per nutritional challenge. (B) Venn diagram displaying overlap between up- and down-regulated genes in the two regimens. (C) Heatmap displaying only differentially expressed genes commonly found in both regimens (fold change > 1.5; P ≤ 0.01). (D and E) Top 5 GO biological processes enriched using gene sets for each regimen, with the −log10(P value) of enrichment shown as bars and the number of matched genes as colored lines. (F) Network displaying Reactome pathways related to metabolism that are enriched by our HMGB1 gene sets from both nutritional challenges. Edge thickness represents the number of genes regulated by HMGB1 among each subcategory. (G) Top upstream regulators identified using the ChEA database, with the −log10(P value) of enrichment as bars and the number of matched genes as the green line. Data are means ± SEM from n = 4 (HMGB1fl/fl) or n = 4 (HMGB1ΔHep) per group for the 12-week HFD protocol and from n = 4 (HMGB1fl/fl) or n = 4 (HMGB1ΔHep) per group for the F/R protocol.

