. 2022 Mar 16;11:e75475. doi: 10.7554/eLife.75475

Figure 1. The TFIIH complex is required for chromosome condensation in Xenopus egg extracts.

(A) Top: Schematic of chromatid assembly in M-phase high-speed supernatant (HSS) extract. Bottom: Representative fluorescence images of fixed samples from a chromatid assembly reaction taken at indicated timepoints after sperm addition. Chromatin was stained with Hoechst. (B) Representative fluorescence images of chromatid assembly at steady state (180 min after sperm addition) in the presence of indicated inhibitors. Each drug or DMSO control was added at 25 min to exclude effects on the protamine-histone exchange process. Final inhibitor concentrations: Triptolide (50 μM), DRB (100 μM), and a-amanitin (54 μM). See Figure 1—figure supplement 1A for CAP-E depletion. Mean condensation parameters for each condition are indicated in lower left corner of each image. (C) Scatter plot of the percentage of pixels below a threshold of 35% of image maximum fluorescence intensity (the condensation parameter), which measures the progressive change in the fluorescence intensity distribution that occurs during condensation, for each condition. Error bars represent SD, and the mean values are indicated. n = 20 structures for each condition. Two biological replicates were performed, quantified structures are from a single experiment. (D) Schematic of the TFIIH complex. TFIIH core complex is green, CAK subcomplex in red. (E) Western blot for XPB, p62, and Tubulin in IgG or XPB-depleted extracts. (F) TFIIH complex members that interact with XPB in M-phase HSS extract, as identified by mass spectrometry. Purifications were performed in the absence of chromatin. PSMs = peptide spectrum matches. (G) Representative fluorescence images of chromatid assembly 90 min after sperm addition in IgG or XPB depleted extracts. Chromatin was stained with Hoechst. (H) Western blot for XPF, ERCC1, and Tubulin in IgG or ERCC1-depleted extracts. (I) Representative fluorescence images of chromatid assembly 180 min after sperm addition in IgG or ERCC1-depleted extracts. Chromatin was stained with Hoechst.

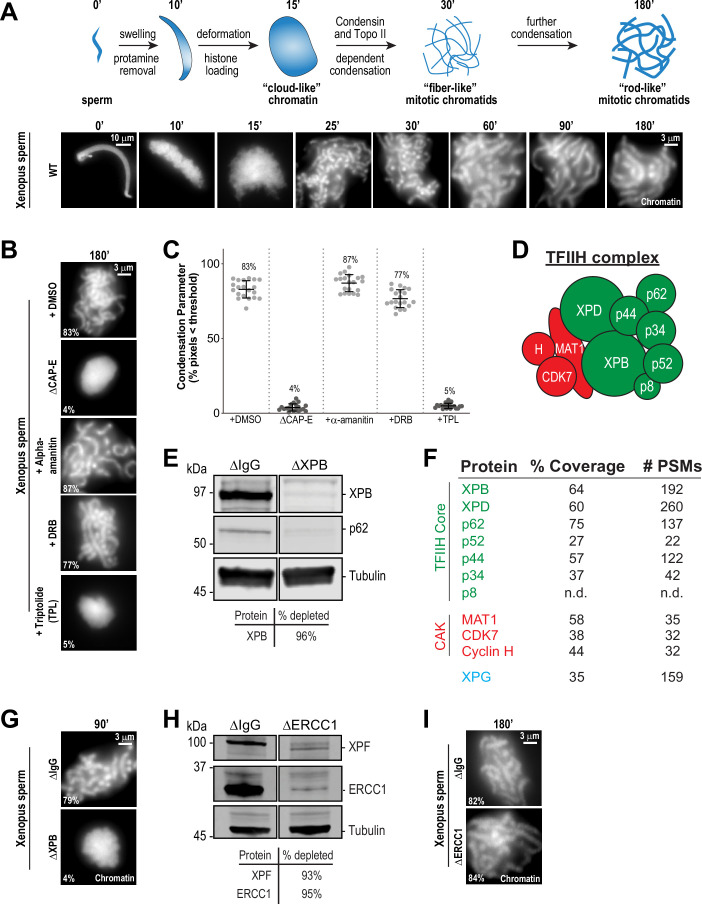
Figure 1—source data 1. Source data for Figure 1E and H.

Figure 1.

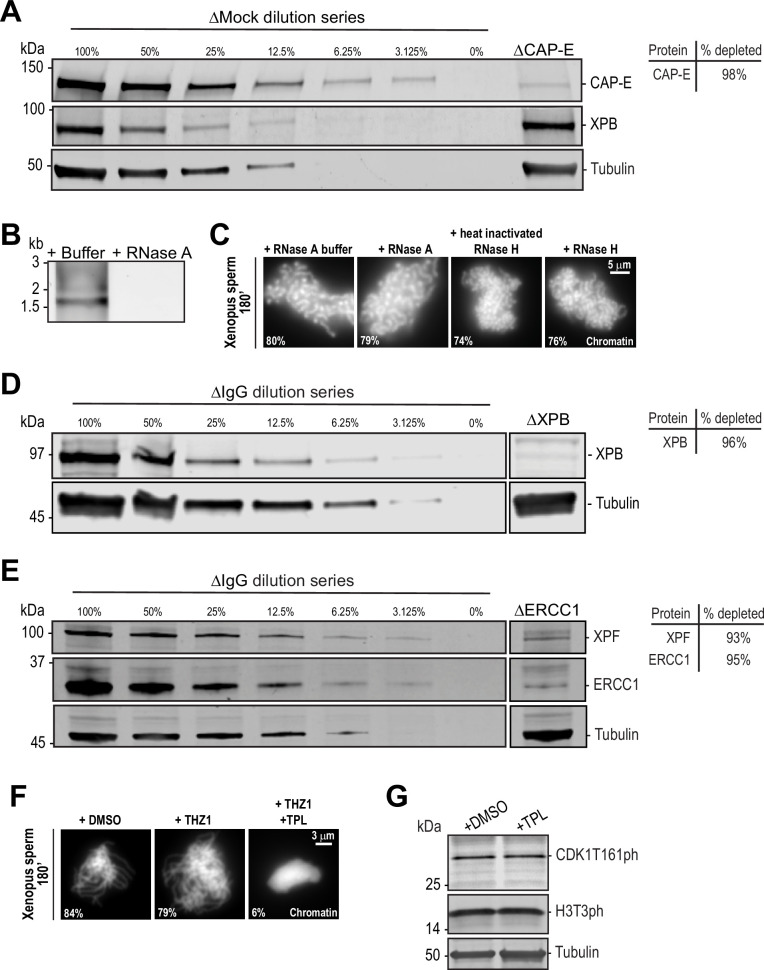
Figure 1—figure supplement 1. Immunodepletions and the effects of RNases and various transcription inhibitors on chromosome condensation and cell cycle state.

Figure 1—figure supplement 1.

(A) Western blot for CAP-E, XPB, and Tubulin in Mock or CAP-E depleted extracts. Dilution series of Mock-depleted extracts was used to calculate the % depletion of CAP-E using quantitative fluorescence. (B) 1% agarose gel stained with SYBR safe stain showing RNase A dependent removal of total RNAs from high-speed supernatant egg extracts. (C) Representative fluorescence images of chromatid assembly at steady state (180 min after sperm addition) in the presence of indicated buffers and enzymes. See Materials and methods for details. Note that the high salt in the RNase H buffer causes morphological changes to chromatids regardless of activity. Mean condensation parameters for each condition are indicated in lower left corner of each image. (D) Western blot for XPB and Tubulin in IgG or XPB-depleted extracts. Dilution series of IgG-depleted extracts was used to calculate the % depletion of XPB using quantitative fluorescence. (E) Western blot for XPF, ERCC1, and Tubulin in IgG or ERCC1-depleted extracts. Dilution series of IgG-depleted extracts was used to calculate the % depletion of ERCC1 and XPF using quantitative fluorescence. (F) Representative fluorescence images of chromatid assembly at steady state (180 min after sperm addition) in the presence of DMSO, 30 μM CDK7 inhibitor THZ1, or 30 μM THZ1 and 50 μM triptolide (TPL). (G) Triptolide does not affect CDK1 activation or maintenance of M phase. Western blot for CDK1 T161ph, histone H3T3ph, and Tubulin in M phase HSS extracts in the presence of DMSO or 50 μM triptolide. Both CDK1T161ph (a CDK7 substrate) and H3T3ph are only highly phosphorylated in M phase, and their appearance is not affected by triptolide treatment.
Figure 1—figure supplement 1—source data 1. Source data for Figure 1—figure supplement 1A, B,D, E, G.
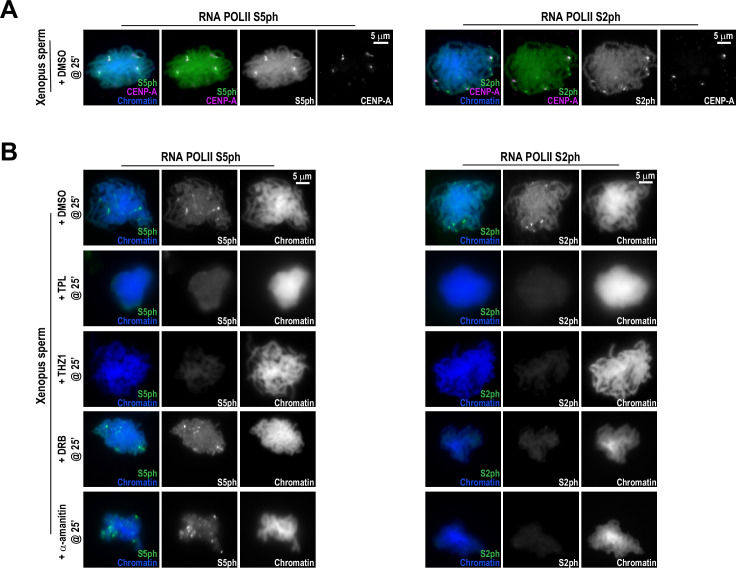
Figure 1—figure supplement 2. Effects of various transcription inhibitors on RNA Polymerase II C-terminal phosphorylation at centromeres.

Figure 1—figure supplement 2.

(A) Representative immunofluorescence images of Xenopus sperm nuclei incubated in HSS extracts for 180 min. DMSO was added at 25 min as a control. Chromatids were labeled with Hoechst, either anti-Pol II S5ph (paused) or anti-Pol II S2ph (elongating), and co-stained with anti-CENP-A antibodies. (B) Representative immunofluorescence images of Xenopus sperm nuclei incubated in DMSO, triptolide (TPL), THZ1, DRB, or alpha-amanitin treated HSS extracts for 180 min. All inhibitors were added 25 min after sperm addition. Chromatids were labeled with Hoechst, anti-Pol II S5ph, or anti-Pol II S2ph antibodies.
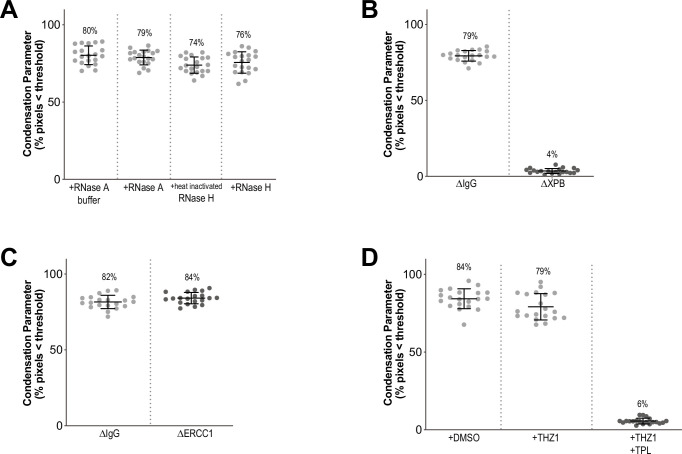
Figure 1—figure supplement 3. Condensation parameters.

Figure 1—figure supplement 3.

(A–D) Scatter plots of the percentage of pixels below a threshold of 35% of image maximum fluorescence intensity (the condensation parameter), for indicated conditions in Figure 1 and Figure 1—figure supplement 1. Error bars represent SD, and the mean values are indicated. n = 20 structures for each condition. Two biological replicates were performed, quantified structures are from a single experiment.