. 2022 Mar 8;11:e75382. doi: 10.7554/eLife.75382

Figure 1. Monitoring microtubule and pronuclear envelopes dynamics in the one-cell Caenorhabditis elegans embryo.

(A–C) Spinning disk confocal micrographs of embryos expressing wild-type GFP::TBB-2 (shown alone, and in green in the merged images) and (A) mCherry::LMN-1 (shown alone and in magenta in the merged image), or (B) mCherry::NPP-22 (magenta, in the merged image), or (C) mCherry::Histone (magenta, in the merged image). Timings in seconds are relative to anaphase onset (0 s). All panels are at the same magnification. Scale bar, 10 μm. (D) Steps of pronuclear envelopes breakdown: pronuclei permeabilization, lamina disassembly (at the poles, between pronuclei), and pronuclear envelopes scission event (membrane gap) relative to anaphase onset were scored in multiple embryos (n). The timing of pronuclear envelopes scission was scored in embryos expressing mCherry::NPP-22 (blue dots, n=7) while the timing of lamina disassembly was scored in embryos expressing mCherry::LMN-1 (orange dots, n=8). (E) Graph presenting the surface area occupied by the pronuclei starting 200 s before anaphase onset (0 s) in embryos expressing GFP::TBB-2 and mCherry::LMN-1. ( F) Graph presenting the intercentrosomal distance normalized to embryo length starting 80 s before anaphase onset (0 s) in embryos expressing GFP::TBB-2 and mCherry::LMN-1 or mCherry::NPP-22.

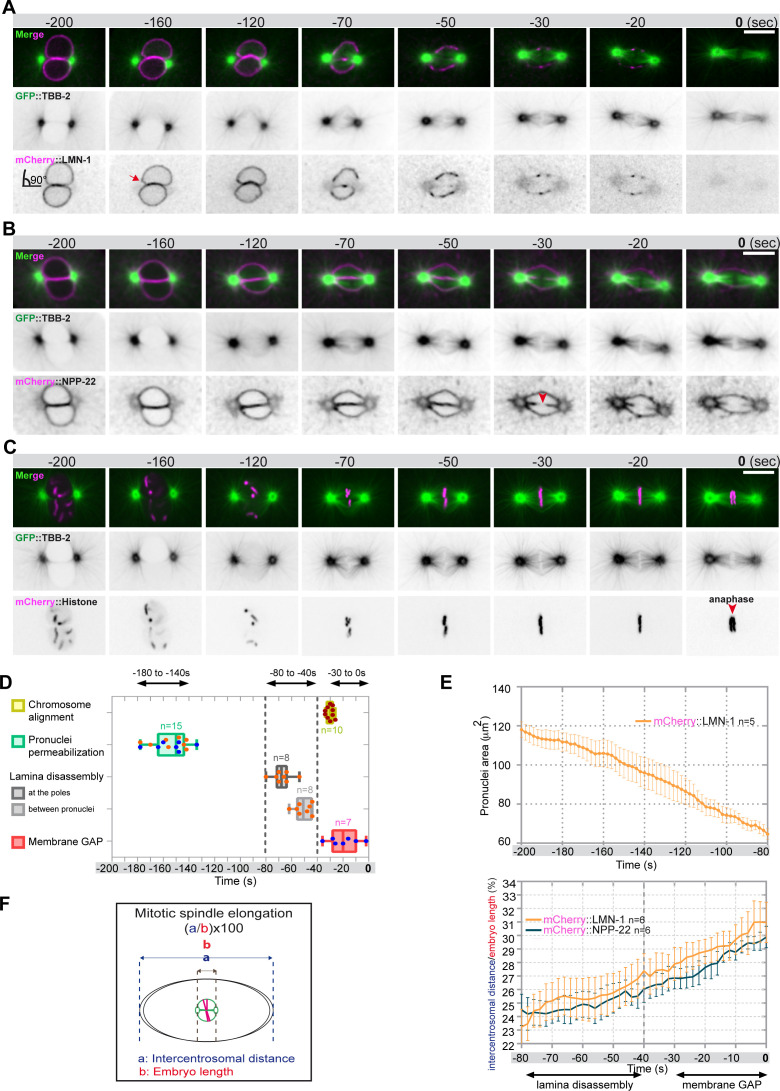
Figure 1—source data 1. Quantification of: (D) The steps of pronuclear envelopes breakdown: pronuclei permeabilization, lamina disassembly (at the poles, between pronuclei), chromosomes alignment, and pronuclear envelopes scission event (membrane gap); (E) The surface area occupied by the pronuclei starting 200 s before anaphase onset (0 s). (F) The intercentrosomal distance normalized to embryo length starting 80 s before anaphase onset (0 s).

Figure 1.

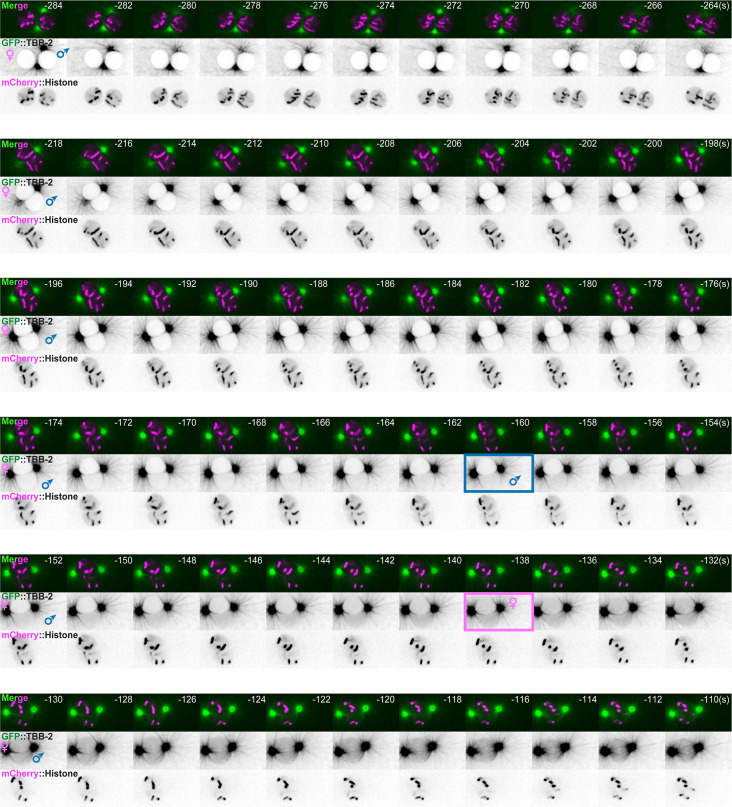
Figure 1—figure supplement 1. Timing of pronuclei permeabilization visualized by the appearance of soluble tubulin in the pronuclei.

Figure 1—figure supplement 1.

Spinning disk confocal micrographs of embryos expressing GFP::TBB-2 (shown alone, and in green in the merged images) and mCherry::Histone (magenta, in the merged image) from pronuclei meeting to membrane permeabilization. The timing of paternal and maternal pronuclei permeabilization is indicated by a blue and pink rectangle, respectively. Time interval every 2 s, relative to anaphase onset (0 s). All panels are at the same magnification. Scale bar, 10 μm.
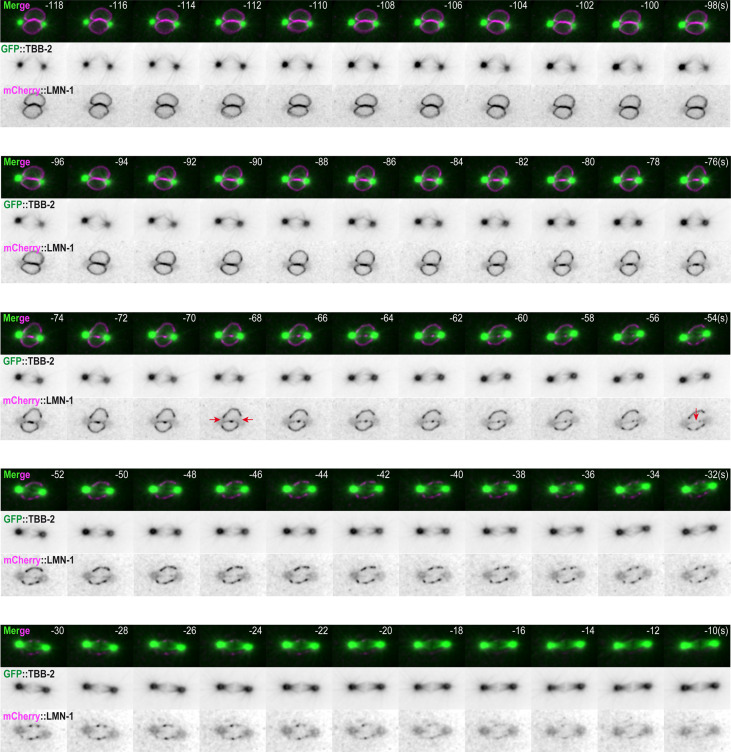
Figure 1—figure supplement 2. Spatio-temporal lamina depolymerization during mitosis.

Figure 1—figure supplement 2.

Spinning disk confocal micrographs of embryos expressing GFP::TBB-2 (shown alone, and in green in the merged images) and mCherry::LMN-1 (shown alone and in magenta in the merged image). Time interval every 2 s, relative to anaphase onset (0 s). All panels are at the same magnification. Scale bar, 10 μm.
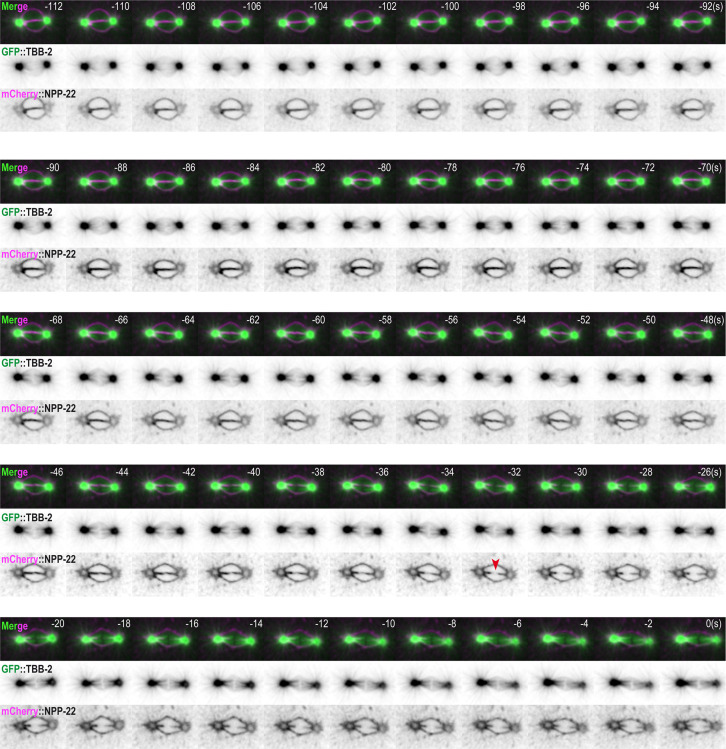
Figure 1—figure supplement 3. Timing of pronuclear envelopes scission.

Figure 1—figure supplement 3.

Spinning disk confocal micrographs of embryos expressing GFP::TBB-2 (shown alone, and in green in the merged images) and mCherry::NPP-22 (shown alone and in magenta in the merged image). Time interval every 2 s, relative to anaphase onset (0 s). All panels are at the same magnification. Scale bar, 10 μm.
Figure 1—video 1. Embryos expressing mCherry::LMN-1 (magenta) and GFP::TBB-2 (green).
Download video file (965.5KB, mp4)
Figure 1—video 2. Embryos expressing mCherry::NPP-22 (magenta) and GFP::TBB-2 (green).
Download video file (581.6KB, mp4)
Figure 1—video 3. Embryos expressing mCherry::Histone (magenta) and GFP::TBB-2 (green).
Download video file (598.3KB, mp4)