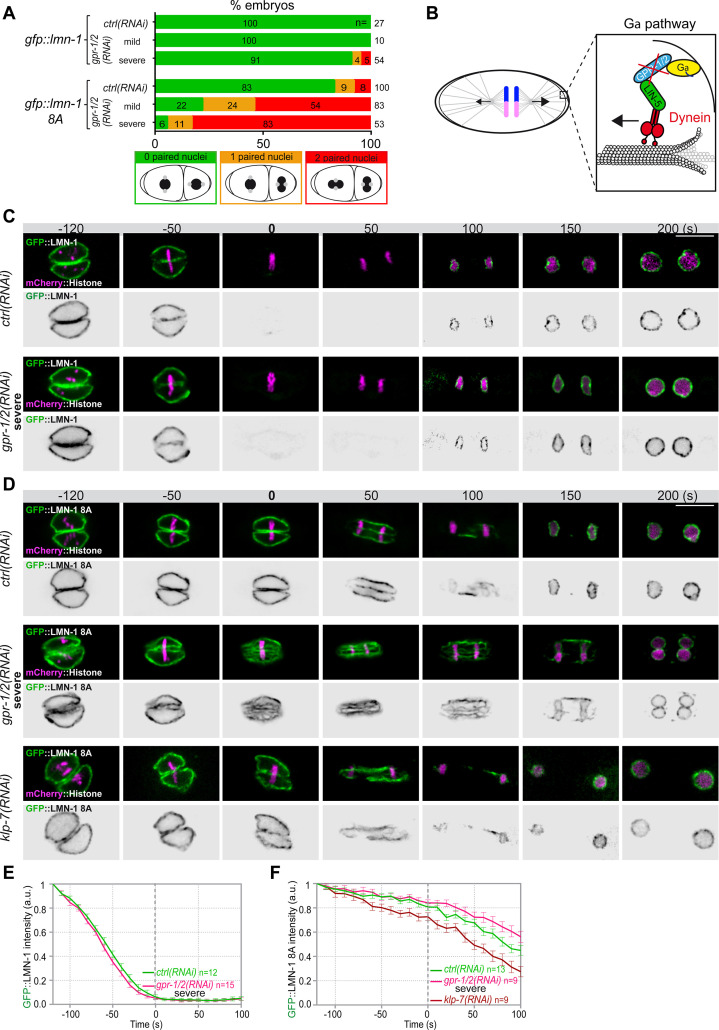
Figure 2. Astral microtubule pulling forces contribute to the union of the parental chromosomes during mitosis.
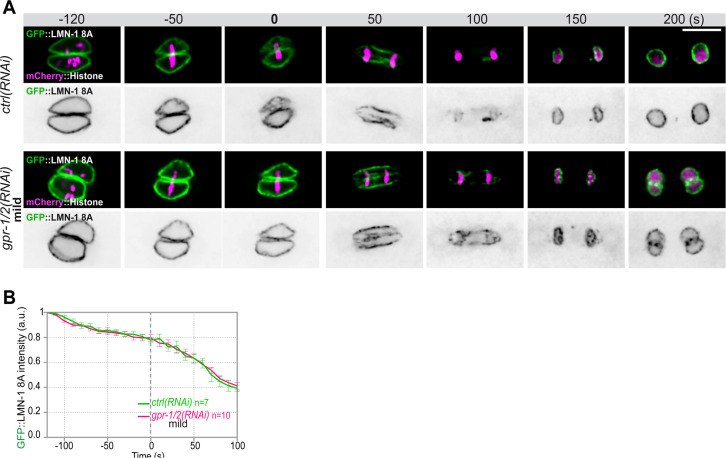
(A) Percentage of lmn-1∆; gfp::lmn-1 and lmn-1∆; gfp::lmn-1 8A embryos presenting 0 (green bars), 1 (orange bars), or 2 (red bars) paired nuclei at the two-cell stage upon exposure to mock RNAi (ctrl) or gpr-1/2(RNAi) at 20°C. The number of embryos of the indicated phenotype (n) is shown in the graph and was collected from more than three independent experiments. (B) Schematics of a one-cell Caenorhabditis elegans embryo in anaphase. The astral pulling forces mediated by the Gα pathway are schematized in the inset. This pathway, which comprises a complex of Gα (yellow), GPR-1/2 (blue), and LIN-5 (green), anchors dynein (red) to the cell cortex to generate pulling forces when dynein walks toward microtubule minus ends anchored at the spindle poles. Inactivation of GPR-1/2 (red cross) suppresses the astral pulling forces. (C, D) Spinning disk confocal micrographs of early lmn-1∆ mutant embryos expressing (C) wild-type GFP::LMN-1 or (D) GFP::LMN-1 8A (shown alone, and in green in the merged images) and mCherry::Histone (magenta, in the merged image) exposed to mock RNAi (ctrl) in the upper panels or gpr-1/2 and klp-7 RNAi in the lower panels. Times are in seconds relative to anaphase onset (0 s). All panels are at the same magnification Scale bar, 10 μm. (E, F) Quantification of (E) GFP::LMN-1 or (F) GFP::LMN-1 8A fluorescence signal intensity over time from central single focal planes above background at the nuclear envelope in embryos of the indicated genotype during mitosis. Times are in seconds relative to anaphase onset (0 s). The average signal intensity of GFP::LMN-1 and GFP::LMN-1 8A at 120 s before anaphase was defined as 1. The data points on the graphs are the normalized average signal intensity per pixel results ± SEM for n embryos of the indicated genotypes. Data were collected from three independent experiments.


