(
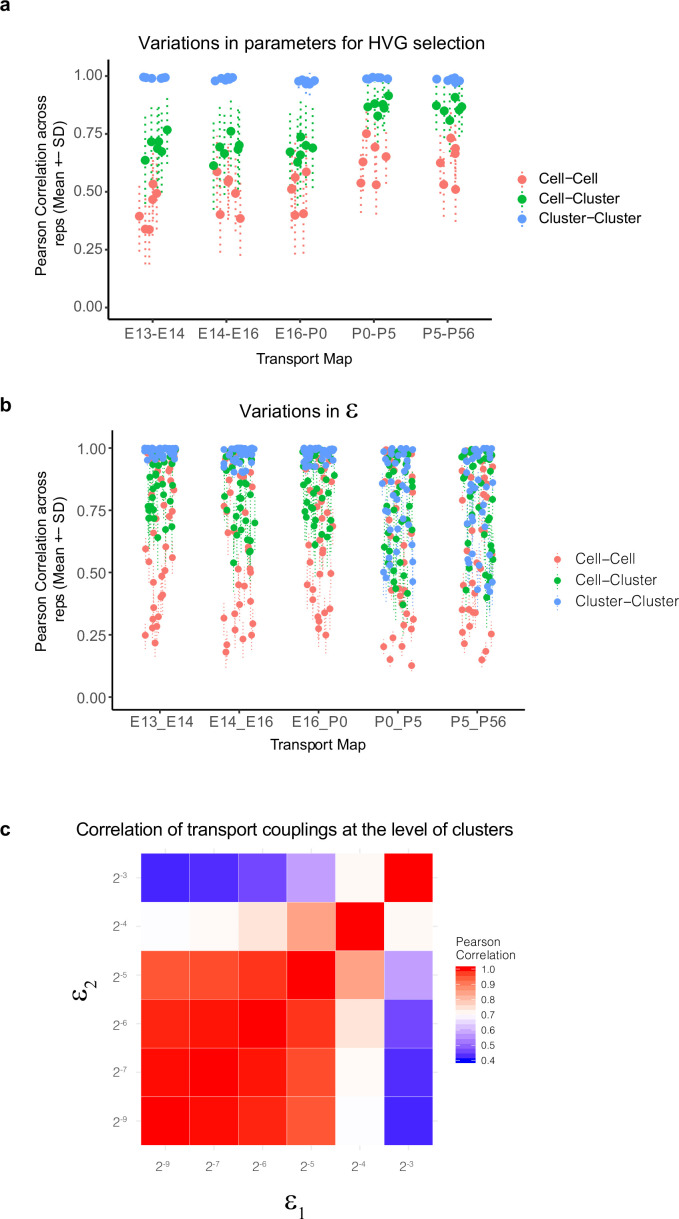
a) Variations in WOT-inferred temporal couplings (
) at the level of cells and clusters to changes in the set of highly variable genes (HVGs) used for computing transport maps. Four sets of features were tested corresponding to the top 800, 1100, 1400, and 1800 HVGs based on our previously described Poisson-Gamma model (
Liu et al., 2018). Using these sets, we inferred four corresponding transport maps at each of the five age pairs embryonic day (E)13–E14, E14–E16, E16–postnatal day (P0), P0–P5, and P5–P56. The entropic regularization hyperparameter
(see panels
b,
c) was held constant at a value 2
–7 in these tests. At each age pair, we computed the Pearson correlation coefficient (PCC) between estimated temporal couplings for every older cell (column of the transport map
) across each pairwise combination of the four transport maps, towards a total of six combinations. These are indicated as red dots and lines (mean ± SD). We then grouped (summed) the rows of the transport map by transcriptomic cluster at the younger age, such that each element of the new matrix indicates cell (column)–cluster (row) couplings. The PCC values of these couplings were computed for each older cell (column) within each pairwise combination of the four transport maps and are indicated as green dots and lines (mean ± SD). Finally, we grouped (summed) both the rows and columns of the transport map by transcriptomic cluster at either age to obtain a matrix of cluster–cluster couplings. The PCC values of these couplings were computed for each older cluster within each pairwise combination of the four transport maps and are indicated as blue dots and lines (mean ± SD). We find that the cell–cell couplings increase in robustness at later ages, but the cell–cluster and cluster–cluster couplings are quite robust (correlation >0.6). (
b) Variations in WOT-inferred temporal couplings at the level of cells and clusters as in panel (
a), but to changes in the entropic regularization
. Six values were used (2
–8 , 2
–7 , 2
–6, 2
–5, 2
–4, 2
–3) with increasing values corresponding to more transport maps with decreasingly localized (or increasingly distributed) couplings. At each age pair, six transport maps are computed and PCC values for cell–cell, cell–cluster, and cluster–cluster couplings are computed as in panel (
a) for each of the 15 transport map pairs. Here too, the cluster–cluster and cell–cluster couplings show higher stability, although at later stages higher values of
exhibit loss of stability even at the cluster–cluster level (see panel
c). (
c) Heatmap showing cluster–cluster PCC values for P5–P56 transport maps inferred using different values of the entropic regularization parameter, epsilon (rows and columns). Loss of stability occurs at higher values of the entropic regularization, consistent with panel (
b). Based on this, we used ε = 2
–7 to calculate the results shown in
Figure 4.


