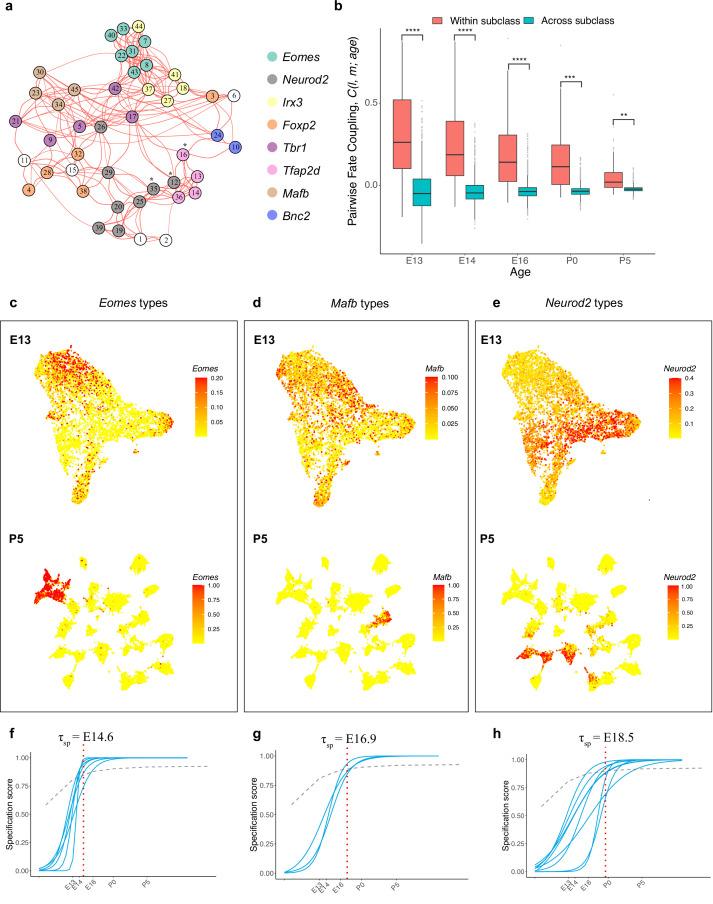
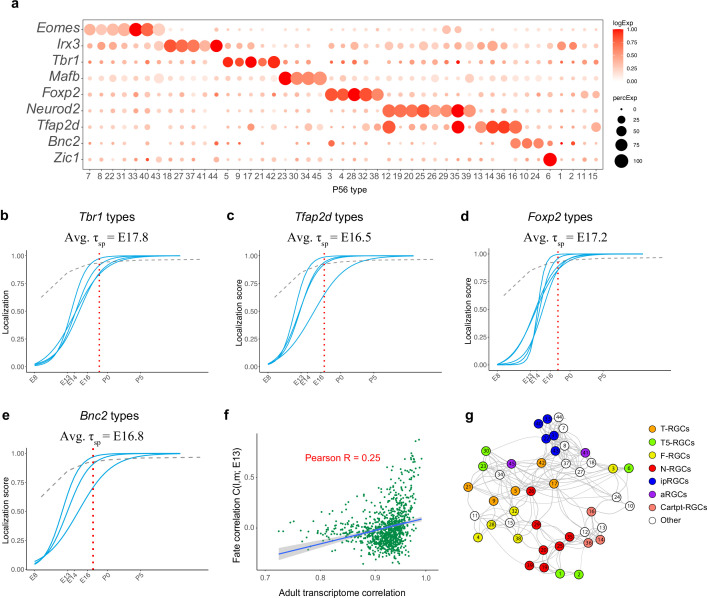
Figure 6. Temporal dynamics of retinal ganglion cell (RGC) subsets expressing specific transcription factors (TFs).
(a) Embryonic day (E)13 network graph of fate couplings from Figure 5a, with RGC types colored based on their selective expression of TFs at postnatal day (P)56. Asterisks denote 3/45 types that express more than one TF (also see Figure 6—figure supplement 1a). (b) Box-and-whisker plots showing that pairwise fate couplings are higher between types within the same TF subclass than between types in different TF subclasses at all immature ages. Black horizontal line, median; bars, interquartile range; vertical lines, 1st and 99th percentile; dots, outliers. Asterisks indicate significant p-values based on a two-sided t-test (****p<10–7; ***p<10–5; **p<10–2). (c) Eomes+ types. Top: Uniform Manifold Approximation and Projection (UMAP) representation of E13 RGCs with cells colored based on their cumulative fate association towards the seven Eomes+ types. Bottom: UMAP representation of P5 RGCs with cells colored based on their cumulative fate association towards the seven Eomes+ types. The value corresponding to the color of each cell (colorbar, right) can be interpreted as the probability of commitment towards the corresponding subclass. Note that the color does not denote the expression level for the gene. (d) Same as (c) for Mafb+ types. (e) Same as (c) for Neurod2+ types (f–h). Localization curves (as in Figure 5g) for Eomes+ types (f), Mafb+ types (g), and Neurod2+ types (h). The mean inferred specification time for each group is indicated on the top of each panel.


