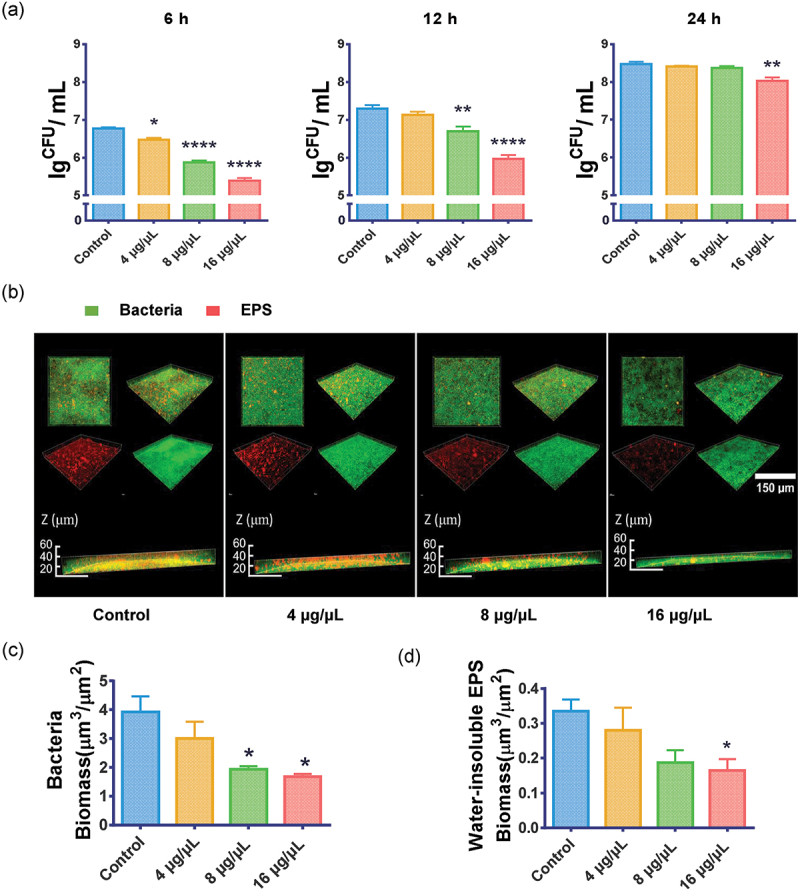
Figure 2.

Effect of NAM on S. mutans biofilm. (a) Effect of NAM on S. mutans biofilm formation assessed by measuring the number of CFU in the 6 h, 12 h and 24 h biofilm. (b) Three-dimensional visualization and double-labeling imaging of 6 h biofilms of S. mutans formed on glass coverslips under NAM treatment. Live bacteria and EPS were green-labeled and red-labeled, respectively. (c) and (d) Quantification of the amounts of EPS and bacteria in each scanned layer of 6 h biofilms of S. mutans. The biomass of bacteria (c) and EPS (d) in each group. Values represent the means and standard deviations from three independent experiments (*P < 0.05, **P < 0.01, ****P < 0.0001 compared with the untreated control).
