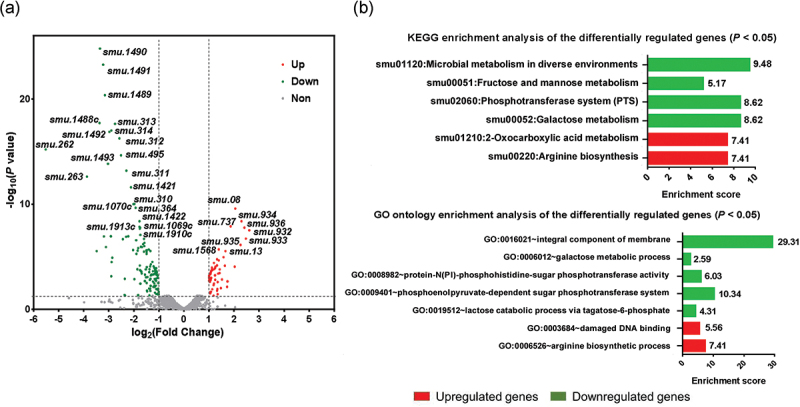
Figure 3.

Transcriptomic analysis of NAM-treated S. mutans strain. (a) Visualization of differentially expressed genes (DEGs) with the volcano plot. (b) KEGG enrichment and gene ontology enrichment analysis of the DEGs using the DAVID tool (GO, gene ontology; KEGG, Kyoto Encyclopedia of Genes and Genomes).
