
Fig. 4: Cell Apoptosis was Activated by kars1 Loss-of-function through p53 Pathway.
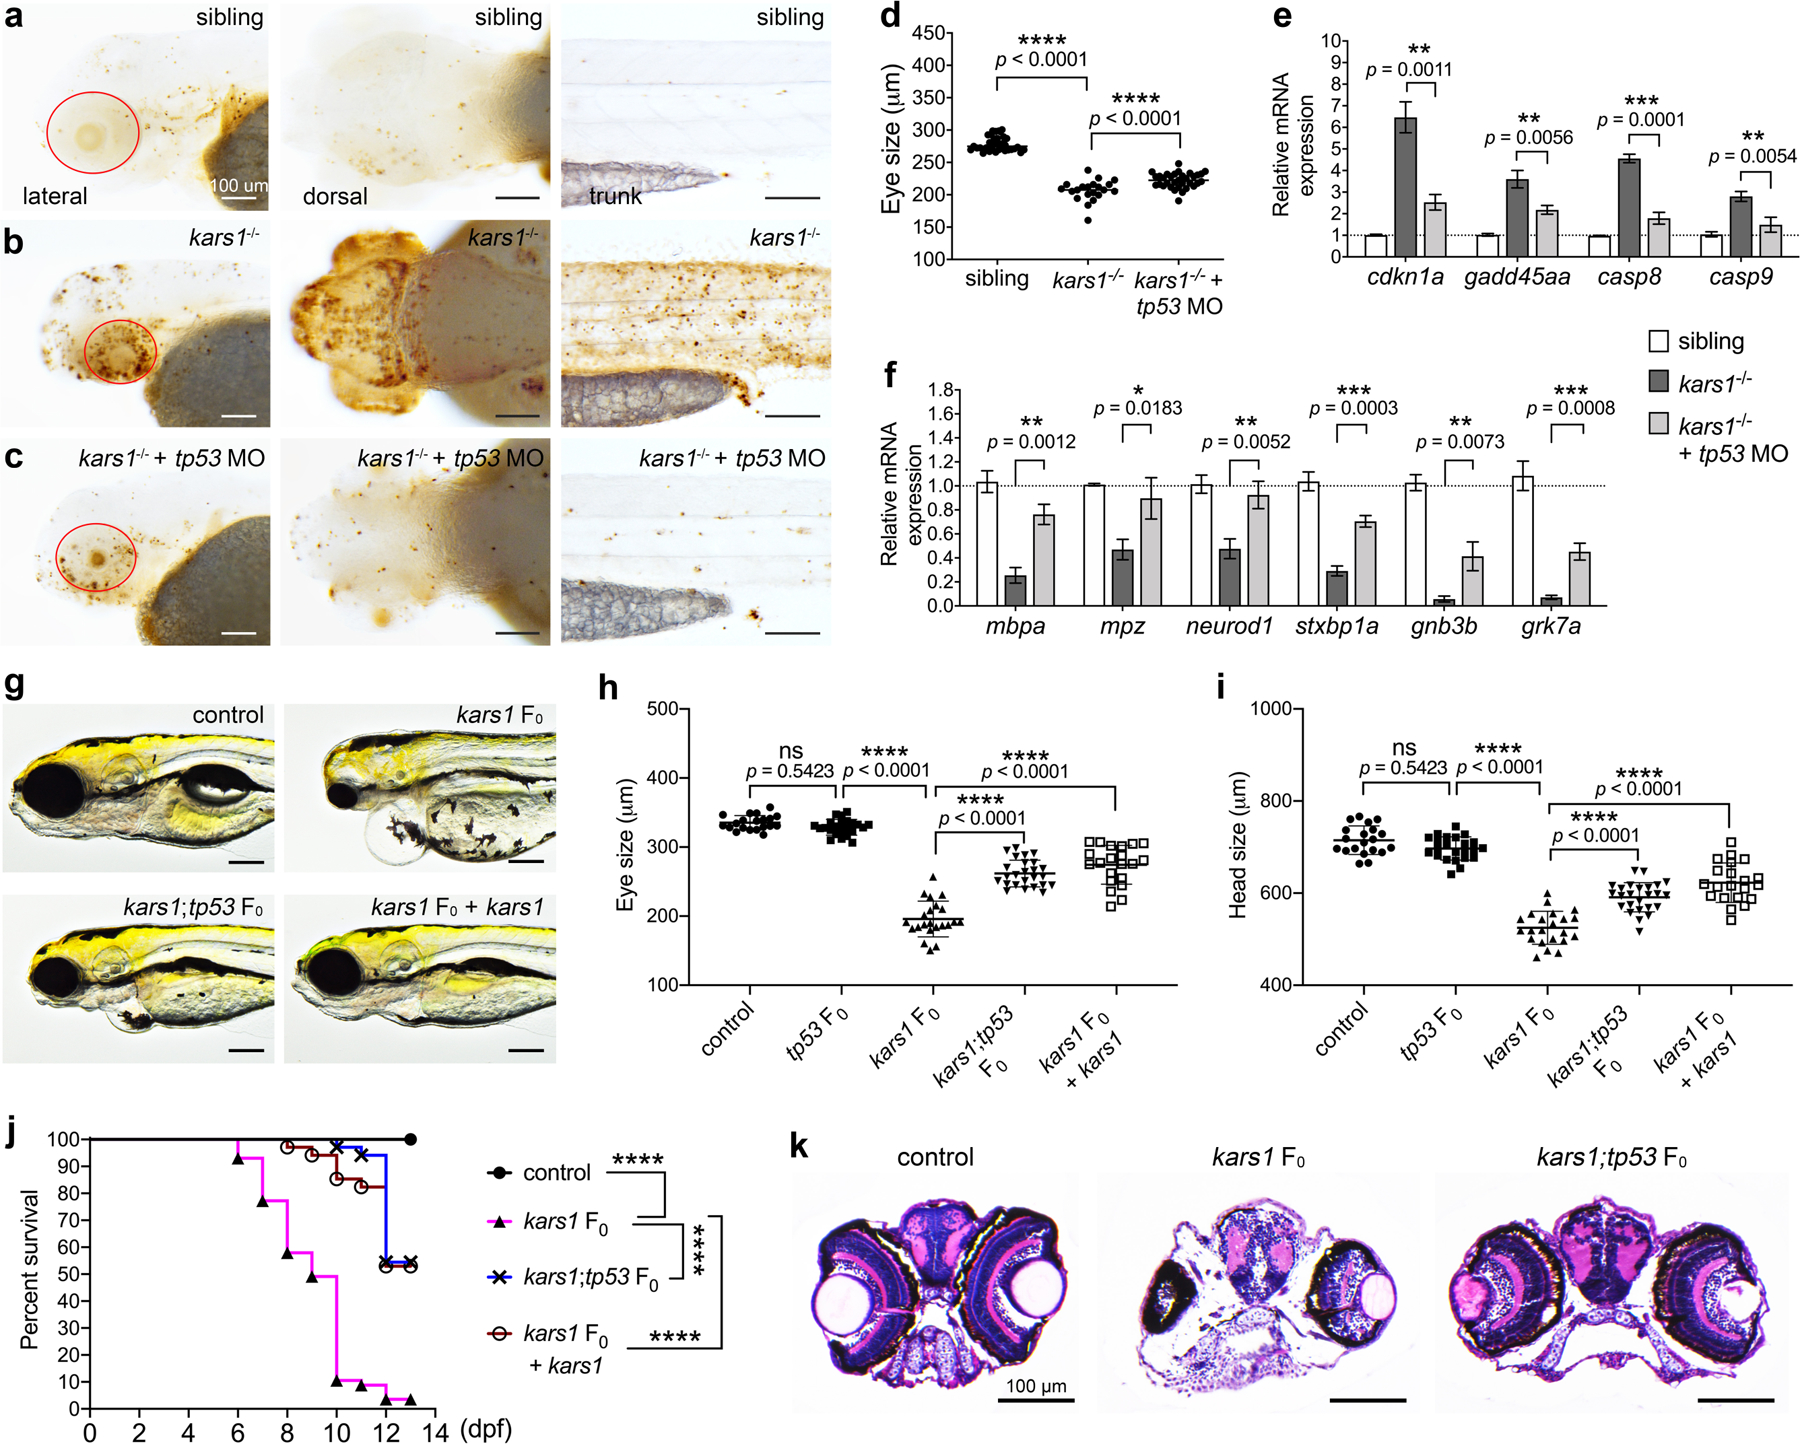
(a-c) Representative images of sibling, kars1−/− and kars1−/− + p53 MO at 3 dpf after TUNEL staining. Red circle indicates eye region. Scale bars = 100 μm. (d) The eye size measurements of sibling, kars1−/− and kars1−/− + p53 MO at 3 dpf. (e) The expression levels of p53 pathway genes were examined by RT-qPCR after p53 MO injection. (f) Those down-regulated genes in RNA-seq data were examined by RT-qPCR after p53 MO injection. For (e, f), the expression levels were normalized to 18S housekeeping gene. Error bars = mean ± SD. Two-tailed unpaired Student’s t-test with Holm-Šídák multiple comparisons correction: ns, not significant p ≥ 0.05, *p < 0.05, **p < 0.01 and ***p < 0.001. (g) Representative images of uninjected control, kars1 F0 mutant, kars1;tp53 F0 mutant, and kars1 F0 mutant co-injected with kars1 mRNA at 5 dpf. Lateral view, anterior to the left. (h, i) Measurement of eye and head size in control, tp53 F0 mutant, kars1 F0 mutant, kars1;tp53 F0 mutant, and kars1 F0 mutant co-injected with 150 picogram (pg) and 200 pg of kars1 mRNA at 5 dpf. For (d, h and i), each symbol represents one animal. Error bars = mean ± SD. One-Way ANOVA with Tukey’s multiple comparisons test: ns, not significant p ≥ 0.05 and ****p < 0.0001. (j) Kaplan-Meier survival curves. Time is shown in days. Log Rank test: ****p < 0.0001. (k) Histology analysis of uninjected control, kars1 F0 mutant and kars1;tp53 F0 mutant by cross section.