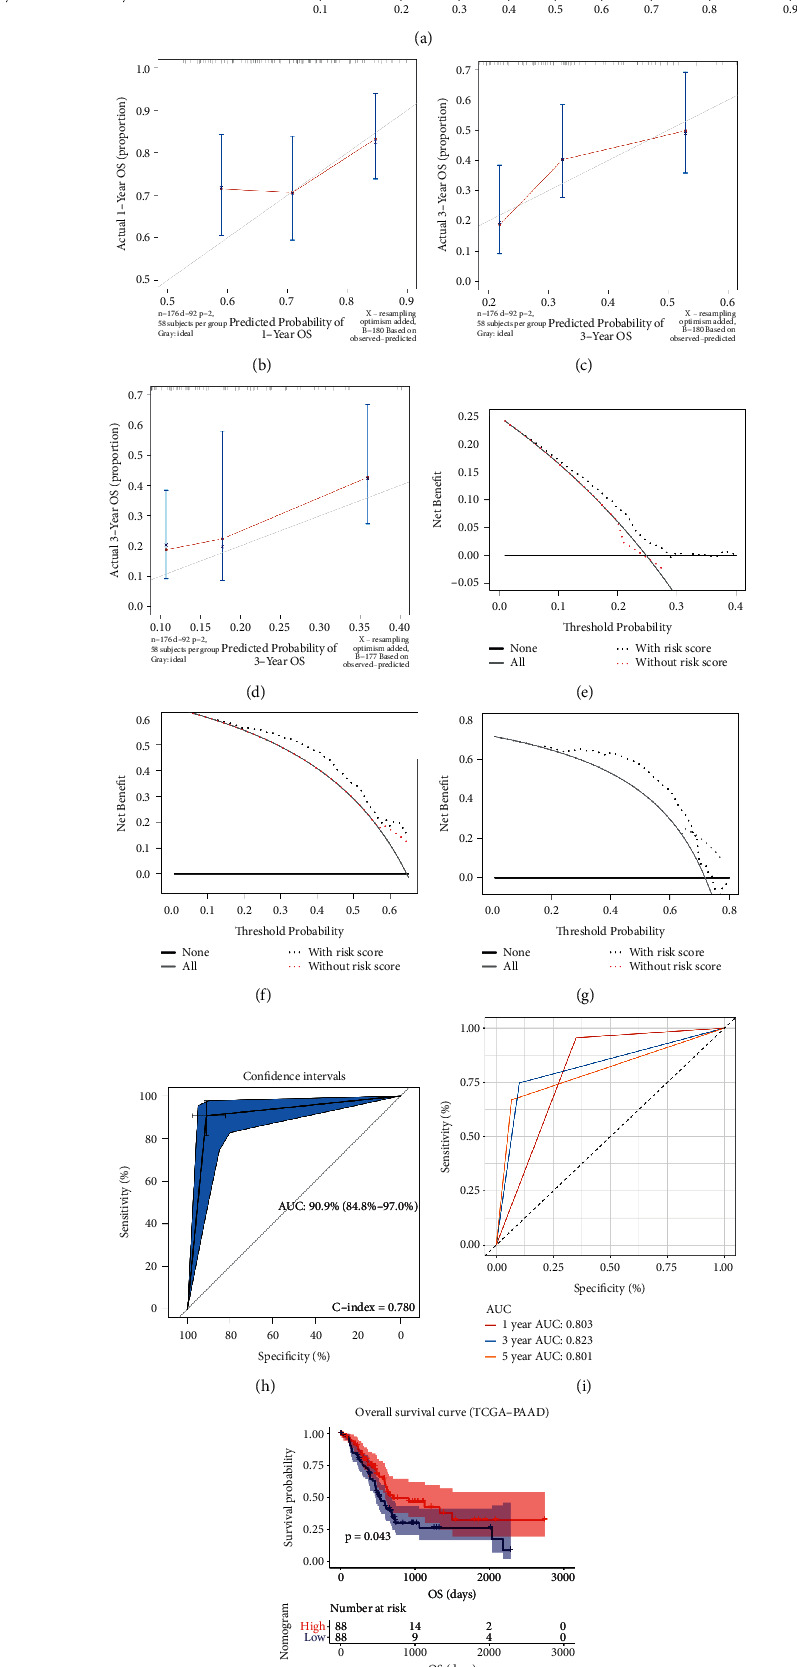
Figure 11.

(a) The nomogram constructed with the immune-related prognostic signature for predicting proportion of patients with 1-, 3- or 5-year OS. The calibration plots for predicting 1- (b), 3- (c), or 5- (d) year OS. DCA for assessment of the clinical utility for 1- (e), 3- (f), or 5- (g) year OS of the immune-related prognostic signature, the x‐axis represents the percentage of threshold probability, and the y‐axis represents the net benefit. OS: overall survival; DCA: decision curve analysis. (h) Receiver operating characteristic (ROC) curves and area under the curve (AUC) statistics to evaluate the diagnostic efficiency of the nomogram based on the immune-related prognostic signature in TCGA-PAAD data. (i) Time-dependent ROC curves indicating the predictive accuracy of the nomogram based on the immune-related prognostic signature for 1-, 3-, or 5- year OS based on TCGA-PAAD data. (j) Survival analysis of the association between risk score calculated by the immune-related prognostic signature and overall survival time in PAAD using TCGA-PAAD data.
