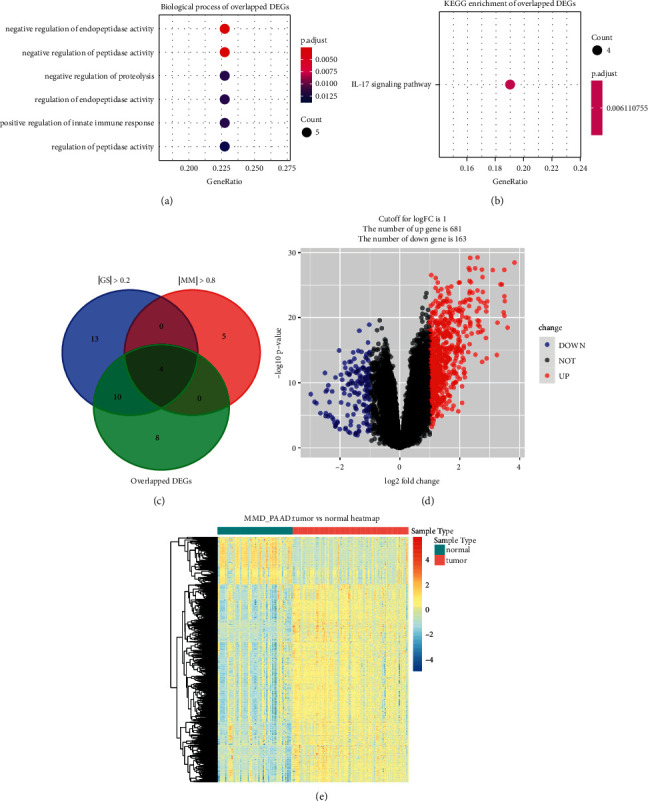
Figure 4.

Bioinformatics analysis of genes based on 22 IRGs and identification of differentially expressed genes (DEGs). (a) GO biological processes analysis. (b) KEGG pathway enrichment. (c) Identification of hub genes by overlapping hub genes in the coexpression network and differentially expressed IRGs. (d) Volcano plot visualizing DEGs in MMD. (e) Heatmap of DEGs between tumor samples vs normal samples (P < 0.05, fold change >1).
