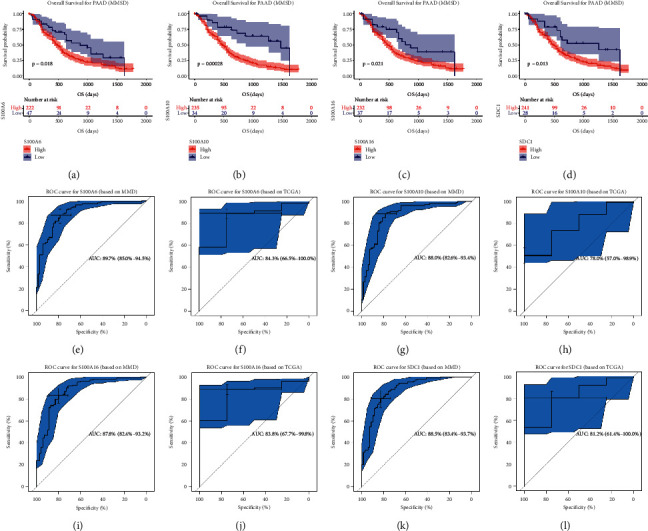
Figure 8.

Validation of survival and prognostic value of hub genes. Kaplan–Meier overall survival (OS) curves for PAAD patients assigned to groups of high and low-expression level of based on the S100A6 (a), S100A10 (b), S100A16 (c), and SDC1 (d), respectively. (e) ROC curve for S100A6 based on TCGA-PAAD (AUC = 0.897). (f) ROC curve for S100A6 based on MMD (AUC = 0.843). (g) ROC curve for S100A10 based on TCGA-PAAD (AUC = 0.826). (h) ROC curve for S100A10 based on MMD (AUC = 0.780). (i) ROC curve for S100A16 based on TCGA-PAAD (AUC = 0.878). (j) ROC curve for S100A16 based on MMD (AUC = 0.838). (k) ROC curve for SDC1 based on TCGA-PAAD (AUC = 0.885). (l) ROC curve for SDC1 based on MMD (AUC = 0.812).
