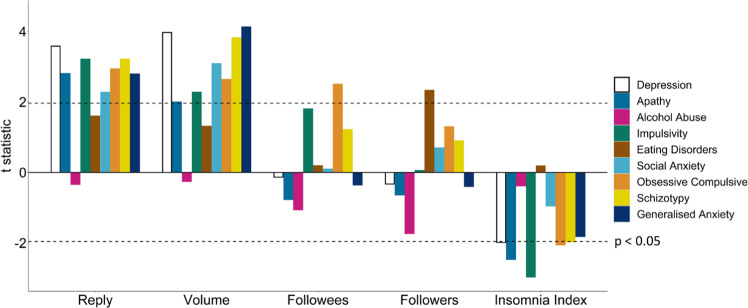
Fig. 2. Associations between 9 self-reported psychiatric questionnaires and Twitter metadata features.
Replies (all β > 0.08, p < 0.05) and volume (all β > 0.03, p < 0.05) of tweets were significantly elevated across all aspects of mental health studied, except for alcohol abuse and eating disorders (n = 1,006). Participants with elevated obsessive-compulsive symptomology tended to follow more accounts (β = 0.03, SE = 0.01, p = 0.01). While participants with more eating disorder symptoms had significantly more followers (β = 0.02, SE = 0.01, p = 0.02). Participants with greater depression, apathy, impulsivity, obsessive-compulsive, and schizotypy symptoms tweeted more at night than during the day (all β < −0.06, p < 0.05). Dashed lines indicate p values below 0.05.

