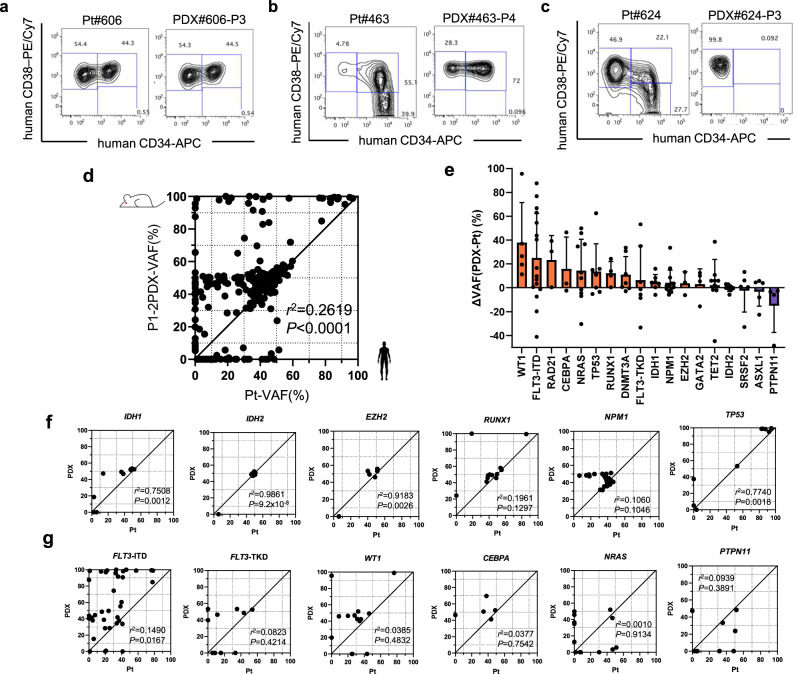
Fig. 2. Diversity in molecular phenotypes between primary AML and their corresponding PDX models.
a–c Flow cytometric analysis of hematopoietic stem cells by the expression of CD34 and CD38 in representative pairs of primary AML patients and AML-PDX models. d Scatter plots showing the variant allele frequencies (VAF) relationship between primary AML cells and P1-2 PDX BM cells. Every dot represents each single genetic alteration. R2 value and two-tailed P-value calculated using Pearson’s correlation indicate the strength and significance, respectively, of the relationships. e Waterfall plots show changes in VAF between primary AML and PDX. Genes in which mutations were detected in more than three patients are shown (WT1, n = 5; FLT3-ITD, n = 16; RAD21, n = 3; CEBPA, n = 3; NRAS, n = 10; TP53, n = 7; RUNX1, n = 4; DNMT3A, n = 7; FLT3-TKD, n = 7; IDH1, n = 7; NPM1, n = 13; EZH2, n = 3; GATA2, n = 4; TET2, n = 9; IDH2, n = 8; SRSF2, n = 5; ASXL1, n = 5; PTPN11, n = 4 biologically independent samples). Bars, median; Error bars, standard deviations. f Scatter plots of VAF relationships between primary AML cells and P1-2 PDX BM cells in genes with strong correlations. g Scatter plots of VAF relationships between primary AML cells and P1-2 PDX BM cells in genes with weak correlations. R2 values and two-tailed P-values calculated using Pearson’s correlation indicate the strength and significance, respectively, of the relationships. Source data are provided as a Source Data file.

