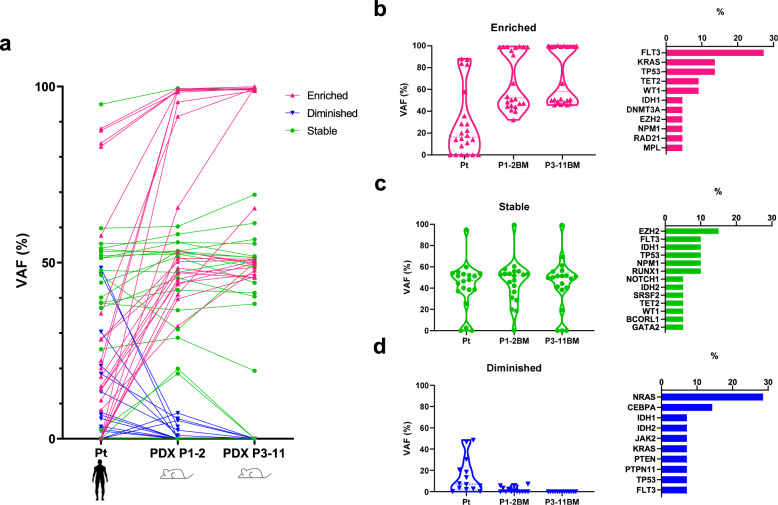
Fig. 4. Clonal selection occurs in AML-PDX models through PDX passaging.
a VAF (%) of primary samples and PDX after serial passaging. Each dot plot indicates the same single alteration (n = 56). b–d Violin plots of the VAF of variants showing b enrichment, c overall similarity, and d reductions from primary through P1-2 to ≥P3 PDX datasets. The relative proportions of genes included in each group are shown in the bar plot. Source data are provided as a Source Data file.

