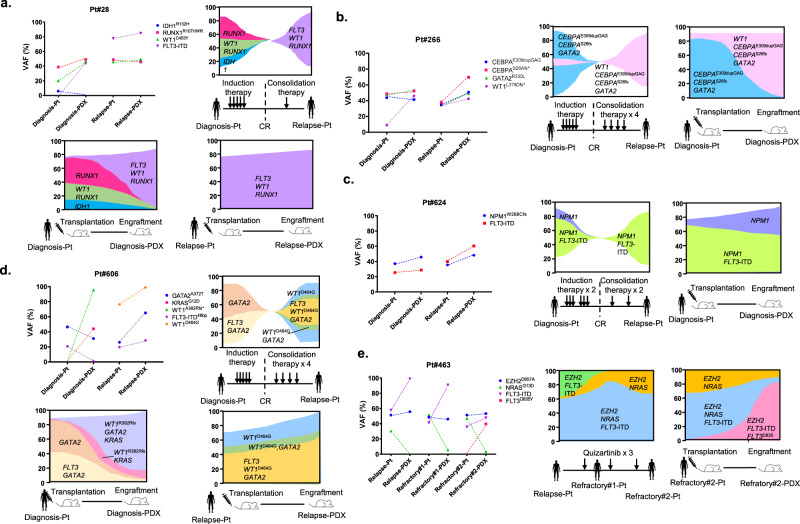
Fig. 6. Serial mutational spectrum and clonal changes in AML patients and their PDX models.
In each patient, clonal changes in the clinical course and PDX engraftment are shown in the fish plot format. a, b Illustrative cases showing that selectively expanded clones in PDX were consistent with clonality at relapse in patients. c A case in which dominant clones consisting of FLT3-ITD and NPM1 mutations persisted in patients at relapse and PDX at engraftment. d A case in which mouse-specific enrichment that did not evolve in a relapsed patient. e A case showing the expansion of a FLT3 inhibitor-resistant clone in PDX. Source data are provided as a Source Data file.

