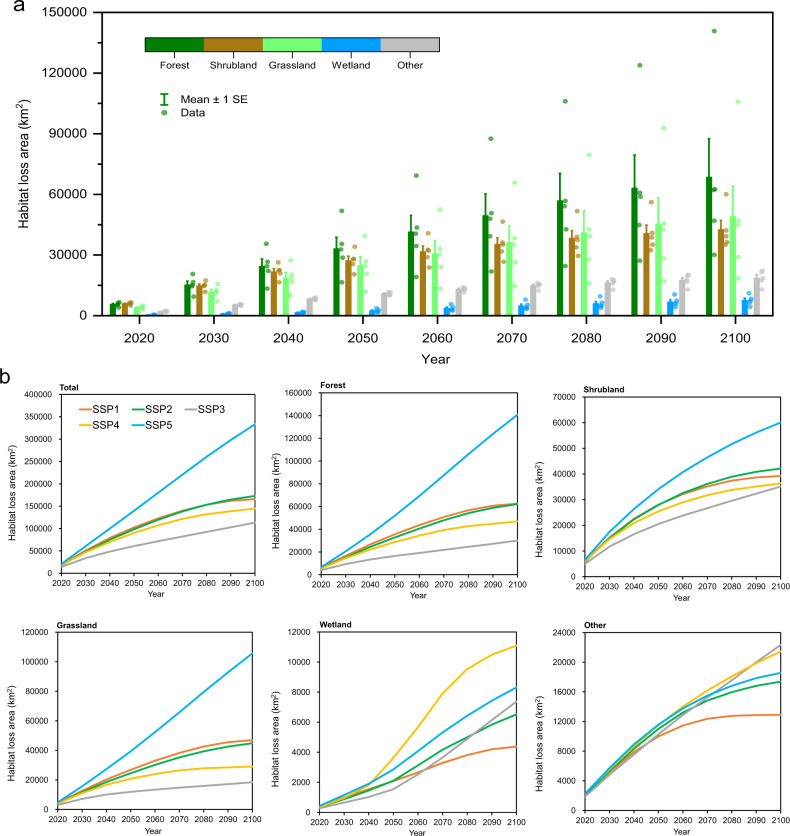
Fig. 1. Future direct habitat loss due to urban expansion under SSP scenarios.
a The habitat loss by 2100 for each habitat type. Bars indicate the mean habitat loss area (five scenarios) for each habitat type. Error bars represent mean values ± 1 SEM for the loss of each habitat type under five scenarios, n = 5 scenarios. Points represent data in five scenarios. b The losses in total area, forest, shrubland, grassland, wetland, and other land.

