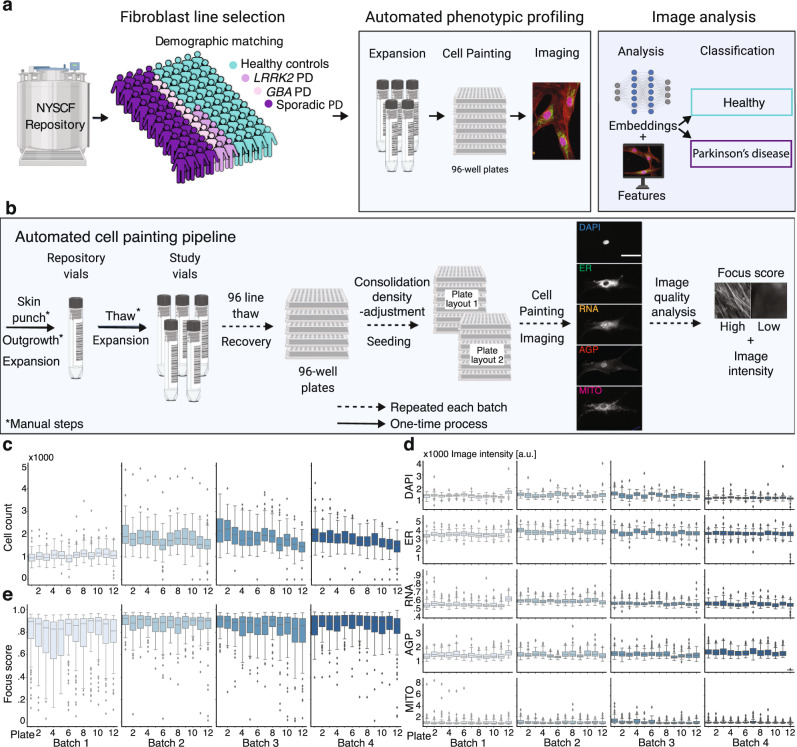
Fig. 1. Automated high-content profiling platform demonstrates reproducibility across batches.
a Workflow overview. b Overview of automated experimental pipeline. Scale bar: 35 μm. Running this pipeline yielded low variation across batches in: c well-level cell count; d well-level foreground staining intensity distribution per channel and plate; and e well-level image focus across the endoplasmic reticulum (ER) channel per plate, for n = 96 wells per plate. Box plot components are: horizontal line, median; box, interquartile range; whiskers, 1.5× interquartile range; black squares, outliers.

