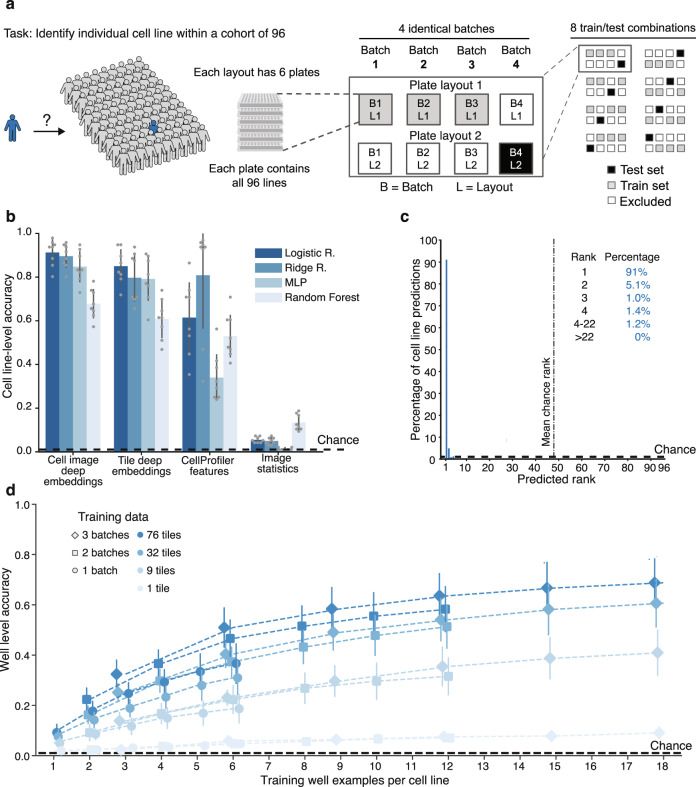
Fig. 3. Robust identification of individual cell lines across batches and plate layouts.
a 96-way cell line classification task uses a cross-validation strategy with held-out batch and plate-layout. b Test set cell line–level classification accuracy is much higher than chance for both deep image embeddings and CellProfiler features using a variety of models (logistic regression, ridge regression, multilayer perceptron (MLP), and random forest). Error bars denote standard deviation across 8 batch/plate layouts. c Histogram of cell line–level predicted rank of true cell line for the logistic regression model trained on cell image deep embeddings from b shows that the correct cell line is ranked first in 91% of cases. d A multilayer perceptron model trained on smaller cross sections of the entire dataset, down to a single well (average of cell image deep embeddings across 76 tiles) per cell line, can identify a cell line in a held-out batch and plate layout with higher than chance well-level accuracy; accuracy rises with increasing training data. Data are presented as mean values ± standard deviation. Dashed black lines denote chance performance.

