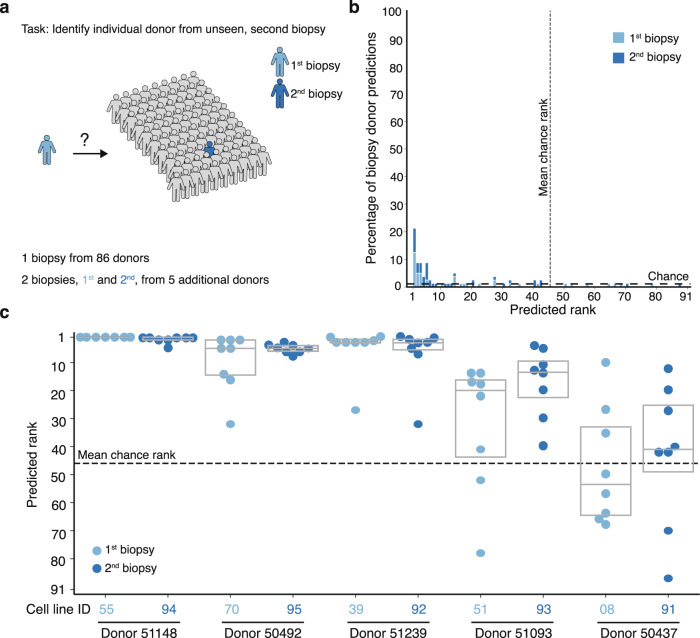
Fig. 4. Donor-specific signatures revealed in analysis of repeated biopsies from individuals.
a The 91-way biopsy donor classification task uses a cross-validation strategy with held-out cell lines, and also held-out batch and plate layout as in Fig. 3a. b Histogram and c box plots of test set cell line–level predicted rank among 91 biopsy donors of the 8 held-out batch/plate layouts for 10 biopsies (first and second from 5 individuals) assessed, showing the correct donor is identified in most cases for 4 of 5 donors. Dashed lines denote chance performance. Box plot components are: horizontal line, median; box, interquartile range.

