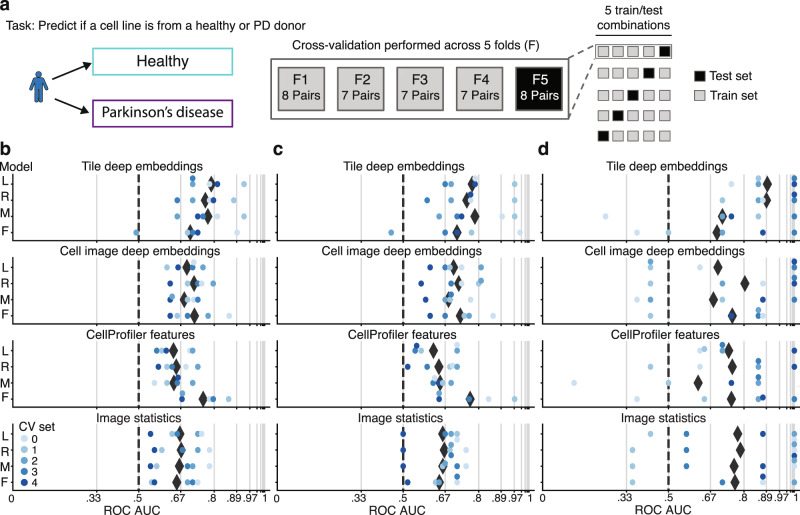
Fig. 5. PD-specific signatures identified in sporadic and LRRK2 PD primary fibroblasts.
a PD vs. healthy classification task uses a k-fold cross-validation strategy with held-out PD-control cell line pairs. Cell line–level ROC AUC, the probability of correctly ranking a random healthy control and PD cell line evaluated on held out–test cell lines for b LRRK2/sporadic PD and controls c sporadic PD and controls and d LRRK2 PD and controls, for a variety of data sources and models (logistic regression (L), ridge regression (R), multilayer perceptron (M), and random forest (F)), range from 0.79–0.89 ROC AUC for the top tile deep embedding model and 0.75–0.77 ROC AUC for the top CellProfiler feature model. Black diamonds denote the mean across all cross-validation (CV) sets. Grid line spacing denotes a doubling of the odds of correctly ranking a random control and PD cell line and dashed lines denote chance performance.

