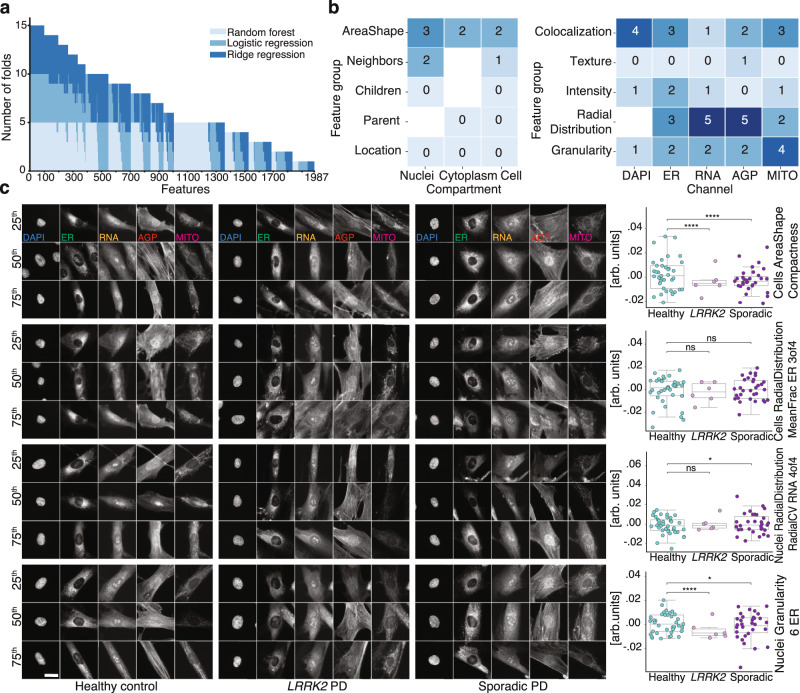
Fig. 6. PD classification is driven by a large variety of cell features.
a Frequency among 5 cross-validation folds of 3 models where a CellProfiler feature was within the 1200 most significant of the 3483 features reveals a diverse set of features supporting PD classification. b Frequency of each class of Cell Painting features of the 100 most common features in a, with correlated features removed. c Images of representative cells and respective cell line–level mean (n = 74 individuals, over all 4 batches) feature values (points and box plot; point colors denote disease state) for 4 features randomly selected from those in b. Cells closest to the 25th, 50th and 75th percentiles were selected. Scale bar: 20 μm. Box plot components are: horizontal line, median; box, interquartile range; whiskers, 1.5× interquartile range. arb. units: arbitrary units. Two-sided Mann–Whitney U test: ns: P > 0.05; *0.01 < P ≤ 0.05; ****P ≤ 0.0001; P values from top to bottom: P < 0.0001, P < 0.0001, P = 0.062, P = 0.44, P = 0.15, P = 0.011, P < 0.0001, P = 0.012.

