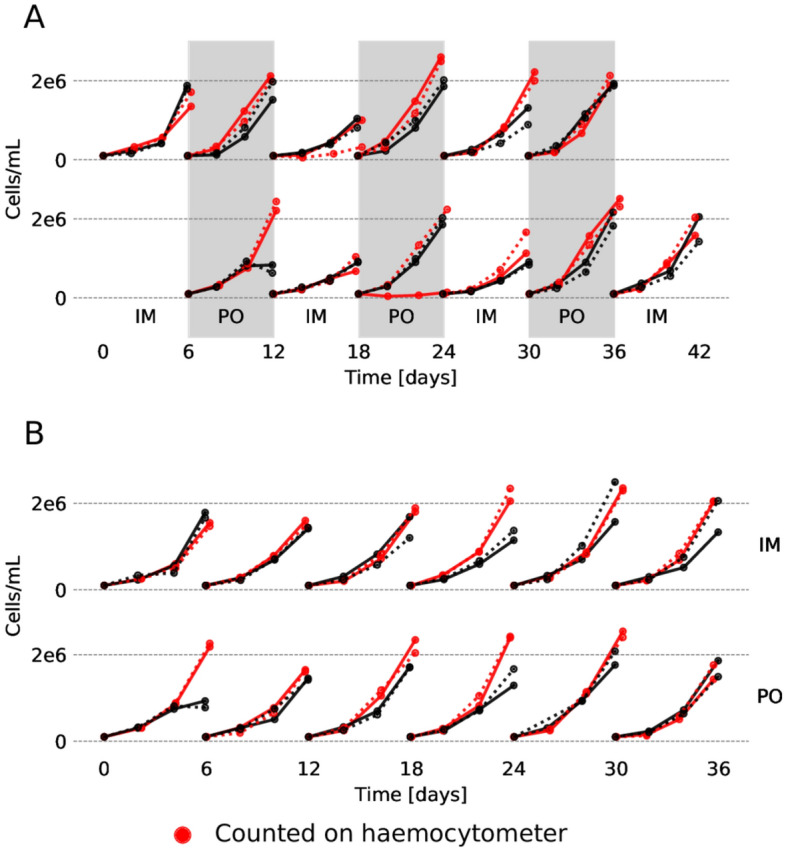
Figure 2.

The number of cells (population size) over time for each culture. The timelines are grouped by the treatment. Replicates that were counted manually using a haemocytomer are indicated by red colour. (A) Cells exposed to drug rotations, aligned in time such that drug exposure coincides. (B) Cells exposed to monodrug therapy (washed every six days but not subject to rotation). The colours and line–styles are consistent between this figure and Fig. S2.
