Figure 5.
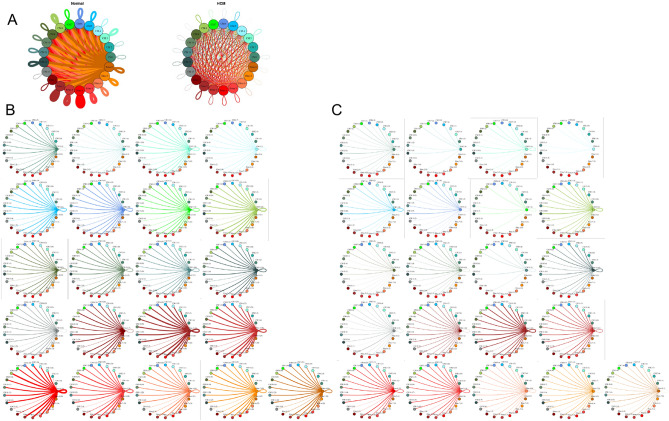
Cell–cell communication networks between cardiac fibroblast and cardiomyocyte subtypes in normal control and HCM conditions. (A) Overall communication network between cardiomyocytes and fibroblasts. Line color indicates ligand broadcast by the cell population with the same color. Lines connect to cell types which expressed cognate receptors. Line thickness is proportional to the number of uniquely expressed ligand-receptor pairs. Loops indicates communication within a cell type. (B,C) Cell–cell communication networks broken down by fibroblast cluster and cardiomyocyte cluster in normal control (B) and HCM (C) conditions. Numbers indicate the quantity of uniquely expressed ligand-receptor pairs between the broadcasting cell type (expressing ligand) and receiving cell type (expressing receptor).

