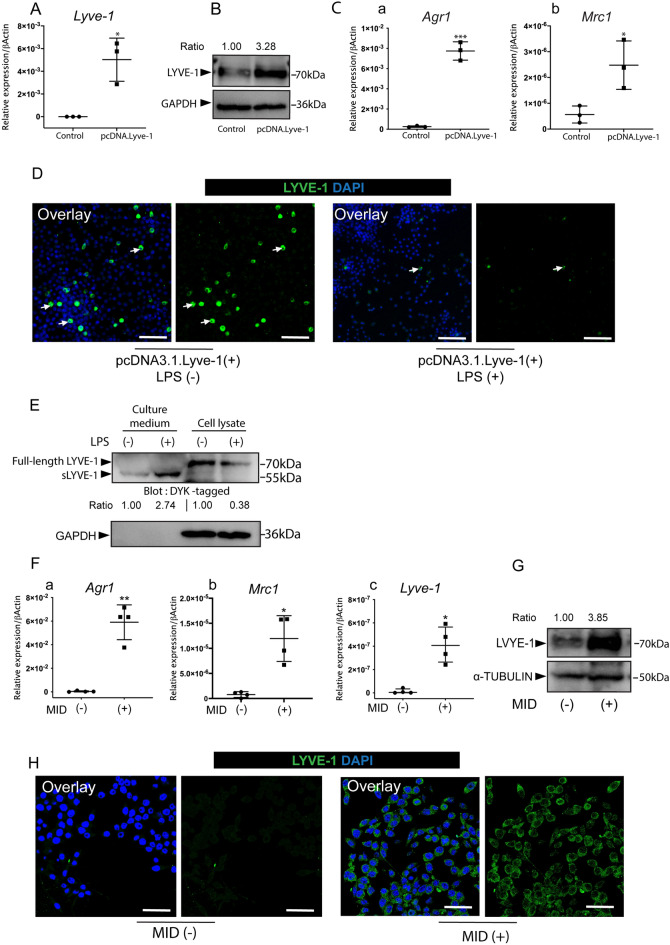
Figure 4.
Pro-/anti-inflammatory stimuli orchestrate the expression of LYVE-1 in RAW264.7 cells. A Lyve1-expression vector (Lyve1_OMu20286D_pcDNA3.1+/C-(K)-DYK) was transfected into RAW264.7 cells to generate Lyve1-expressing macrophages. (A) RT-PCR analysis of Lyve1 in RAW264.7 cells and Lyve1-expressing macrophages (mean ± SD, n = 3). (B) LYVE-1 protein expression of cell lysates collected from RAW264.7 cells and Lyve1-expressing macrophages as revealed by western blotting. (C) RT-PCR analysis of M2 macrophage markers (Agr1, Mrc1) in RAW264.7 cells and Lyve1-expressing macrophages (mean ± SD, n = 3). (D) Lyve1-expressing macrophages were treated with LPS (100 ng/ml) for 4 h. Immunofluorescence staining of LYVE-1 was used to detect LYVE-1-positive macrophages (arrows). (E) Cell lysates and culture media from LPS-treated and -untreated Lyve1-expressing macrophages were analyzed by western blotting with anti-DYK antibody. sLYVE-1, soluble LYVE-1. (F–H) M2 polarization of RAW264.7 cells induced by MID for 7 days. (F) RT-PCR analysis of M2 macrophage markers (Agr1 and Mrc1) (mean ± SD, n = 4) and Lyve1 (median with interquartile range, n = 4) in RAW 264.7 cells and M2-polarized cells. (G) Cell lysates collected from RAW 264.7 cells and M2 polarized cells were analyzed by western blotting with anti-LYVE-1 antibody. (H) Immunofluorescence staining of LYVE-1 in RAW 264.7 cells and M2 polarized cells. Data were collected from three independent experiments, and statistically analyzed by unpaired Welch's t-test (A,Fa,b), unpaired Student’s t-test (Ca,b), or Mann–Whitney U test (Fc). ∗p < 0.05, ∗∗p < 0.01, and ∗∗∗p < 0.0001. Scale bar 100 µm (D) and 50 µm (H).

