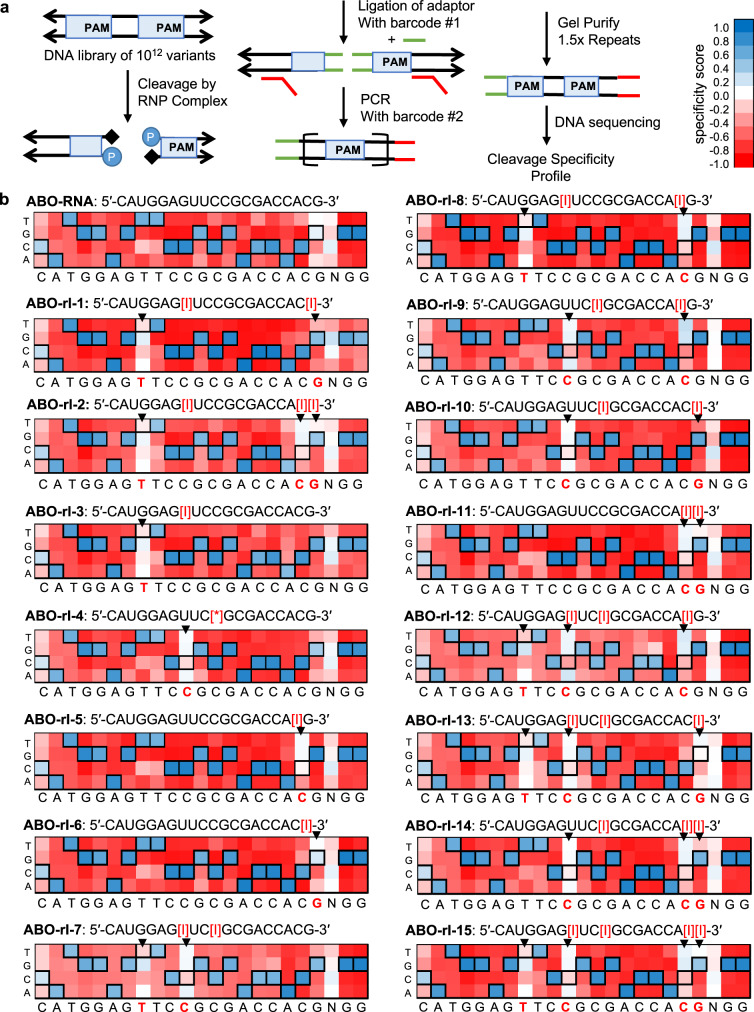
Fig. 2. Inclusion of inosine bases in crRNAs affects specificity mainly at the site of incorporation.
a Diagram depicting the workflow for the high-throughput specificity profiling assay. b Heatmaps corresponding to the specificity profiles of the indicated ribose inosine-modified crRNAs. The positions of inosine bases are indicated by black arrows. Specificity scores of 1.0 (dark blue) correspond to 100% enrichment for, while scores of −1.0 (dark red) correspond to 100% enrichment against a base-pair at a specific position. Black boxes denote the intended target nucleotide.

