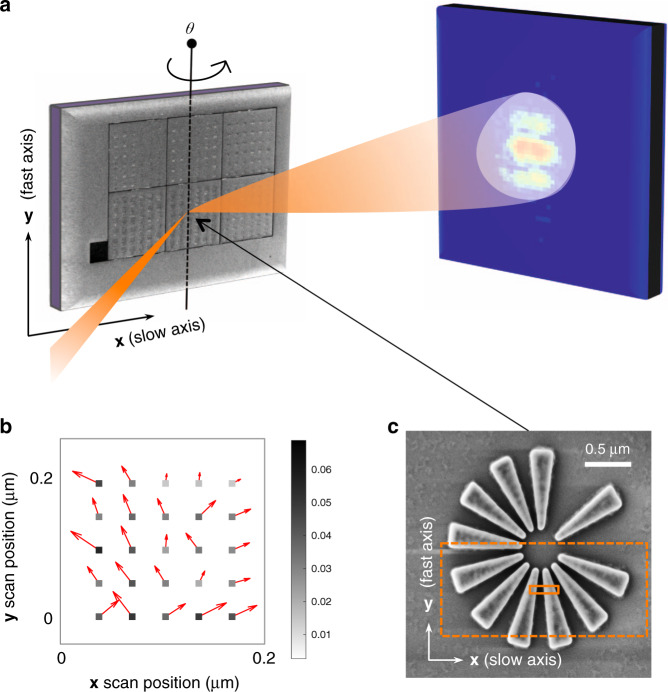
Fig. 1. Bragg ptychography experiment.
a Data acquisition scheme, showing the sample in Bragg condition, illuminated by a focused beam and producing a coherent diffraction pattern, measured by a 2D detector. For the Bragg ptychography data acquisition, the sample is scanned along the x- and y-axis and further angularly scanned along the θ rotation. b For this experiment, the scanning stage was not optimized and a strong discrepancy was observed between the nominal x and y position (square) and the achieved positions (indicated by the red arrows and by the color scale, in μm). c SEM picture of the investigated Si-star sample (top view). The orange rectangles represent the footprint of the intensity central lobe (FWHM) on the sample surface (continuous line) and the full dimension of the retrieved probe, including its tails (dashed line)

