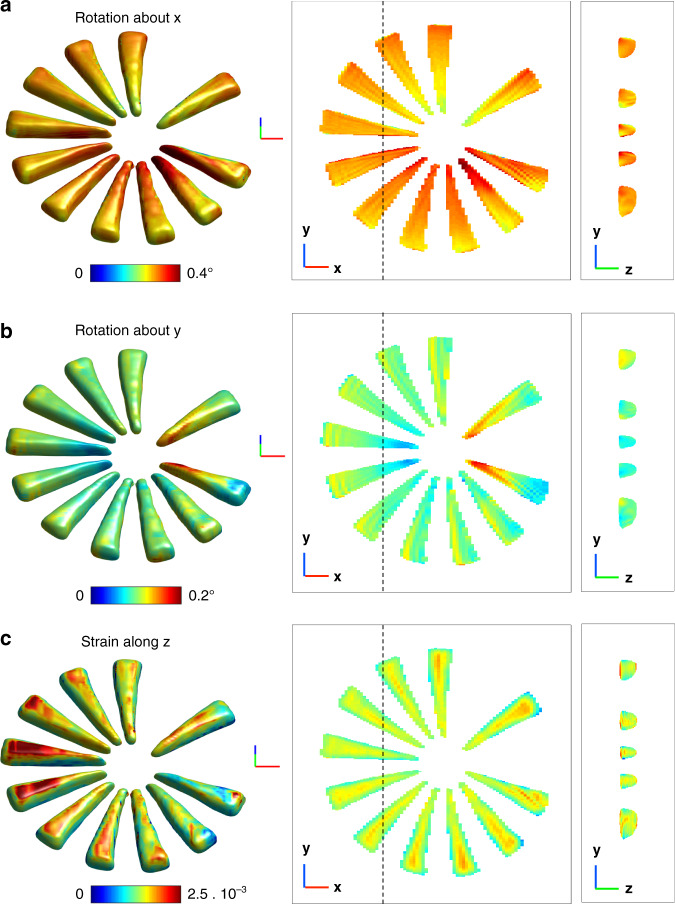
Fig. 3. 3D crystalline properties extracted from the retrieved phase map.
a, b Rotation of the 220 lattice planes, about the x and y axes, respectively. The rotation color map angle is shown in degree. c Strain of the 220 lattice planes. The strain color map is shown in arbitrary units. In a–c, the left column corresponds to a 3D rendering of the map onto the volume defined in Fig. 2a while the middle and right columns are defined as in Fig. 2b, c, respectively. The length of each segment of the 3D frame represents 200 nm

