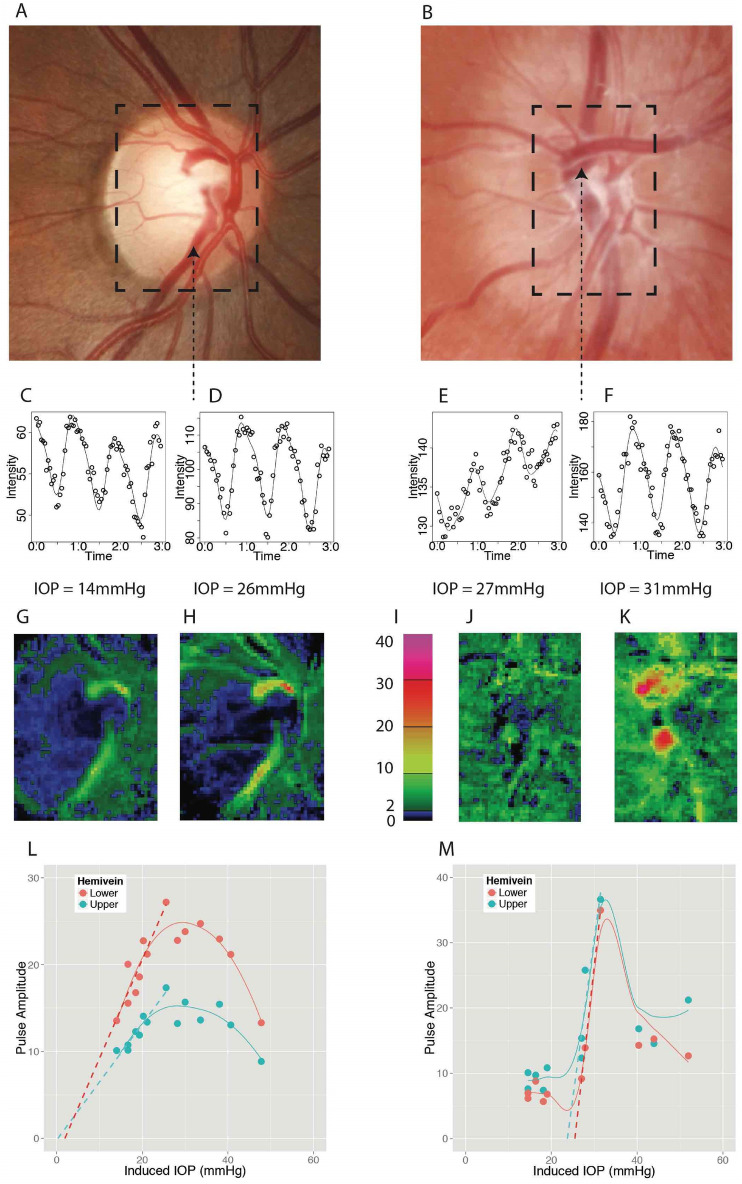
Figure 1.
Schematic diagram explaining the analytical process of estimating ICP. Optic disk photographs of normal (7 mmHg, A) and elevated ICP (31 mmHg, B) eyes. The region of analytical interest (ROI) is shown in the dashed rectangles. Papilloedema can be seen in (B). Two harmonic curve fits are applied to data from all locations across the entire ROI with examples from one location at specified IOP shown in the inferior hemivein in (C) and (D) and superior hemivein in (E) and (F) (arrows). These locations were the sites of maximal pulse amplitude for the respective vessels. The pulse amplitudes in arbitrary units are calculated and mapped to the specified IOP to correspond with the ROI (G,H,J,K) using a false colour scale (I). The maximum pulse amplitude values from the upper and lower hemiveins are chosen automatically from the retinal hemiveins using the map and compared against induced IOP (L,M). Linear regression is applied to the rising part of the curve and extrapolated back through the x-axis coinciding with zero pulsation (dashed lines). This value becomes the estimated ICP in mmHg. In (L) it is 1 mmHg in erect posture equivalent to 11 mmHg in lateral decubitus. In (M) it is 24 mmHg erect posture equivalent to 34 mmHg lateral decubitus. The general shape of the curve can be seen from the locally weighted fit (solid lines).

