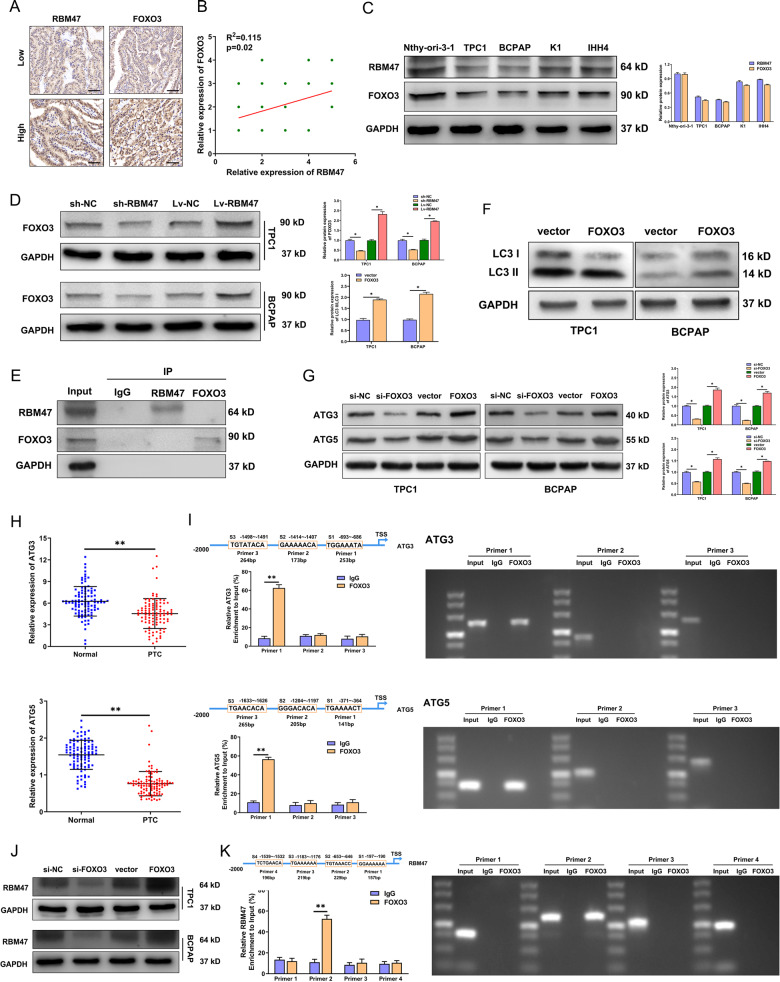
Fig. 2. RBM47 activates autophagy by regulating FOXO3.
A Representative RBM47 and FOXO3 IHC staining of PTC tissues and their correlation. Scale bar = 20 μm. B The correlation of RBM47 and FOXO3 in PTC tissues measured by IHC. C The protein expression of RBM47 and FOXO3 in PTC cells and normal thyroid cells measured by WB. D The protein levels of FOXO3 were detected after RBM47 knockdown or upregulation. E TPC1 cell lysates were subjected to Co-IP with anti-RBM47 or anti-FOXO3 antibody, respectively, and normal rabbit IgG was the control, followed by WB using the indicated antibodies. F LC3 II/LC3 I ratio detected by WB in PTC cells with FOXO3 upregulation. G The protein levels of ATG3 and ATG5 detected by WB in PTC cells with FOXO3 knockdown or upregulation. H The relative mRNA expression of ATG3 and ATG5 in 100 paired PTC tissues and adjacent non-cancerous tissues. I ChIP analysis of FOXO3 binding sites in ATG3 or ATG5 promoter regions in TPC1 cells. IgG was used as the negative control. J The protein levels of RBM47 in PTC cells with FOXO3 knockdown or upregulation. K ChIP analysis of FOXO3 binding sites in RBM47 promoter region in TPC1 cells. IgG was used as the negative control. Statistical differences were analyzed using the independent samples t-test; data are shown as the mean ± standard error of the mean based on three independent experiments. *p < 0.05, **p < 0.01.

