
Figure 5.
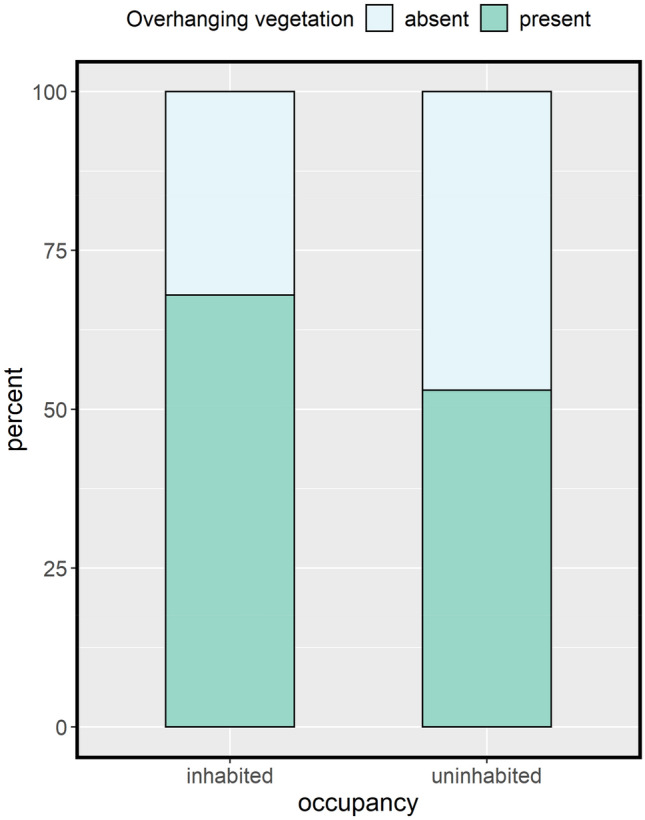
Stacked bar chart showing the differing percentage of inhabited and uninhabited log piles with vegetation overhanging the log pile (green) and with no vegetation overhanging the log pile (blue).
Official websites use .gov
A
.gov website belongs to an official
government organization in the United States.
Secure .gov websites use HTTPS
A lock (
) or https:// means you've safely
connected to the .gov website. Share sensitive
information only on official, secure websites.
Stacked bar chart showing the differing percentage of inhabited and uninhabited log piles with vegetation overhanging the log pile (green) and with no vegetation overhanging the log pile (blue).