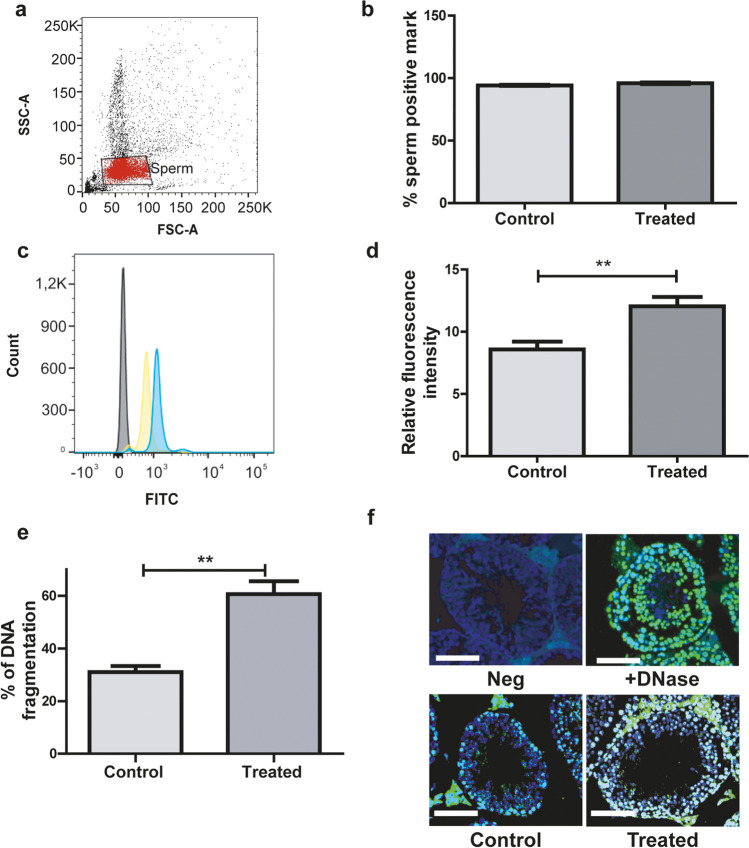
Fig. 1.
Analysis of ROS in sperm samples from control and treated males. a FSC and SSC fluorescence data were collected from 10,000 events per sample. Threshold levels for FSC-A and SSC-A were set to exclude signals from cellular debris or abnormal morphology for all samples. b Percentage of spermatozoa evidencing the presence of ROS. c Representative histogram of the fluorescence spectra obtained through flow cytometry for sperm samples in absence of reporter probe (grey), and sperm samples corresponding to control (yellow) or treated (blue) mice. d Sperm relative fluorescence intensity (positive mark for ROS relative to negative control sample). (b, d) n = 5 males per group, **p < 0.01, Student’s t test. e TUNEL assay results expressed as percentage of DNA fragmentation, n = 6 males per group with a minimum of 4 randomly selected fields per testis. f Representative merge on immunofluorescence images of the TUNEL assay (green: positive TUNEL; blue: DAPI). Scale bar, 100 μm. Nested t test. **p < 0.01

