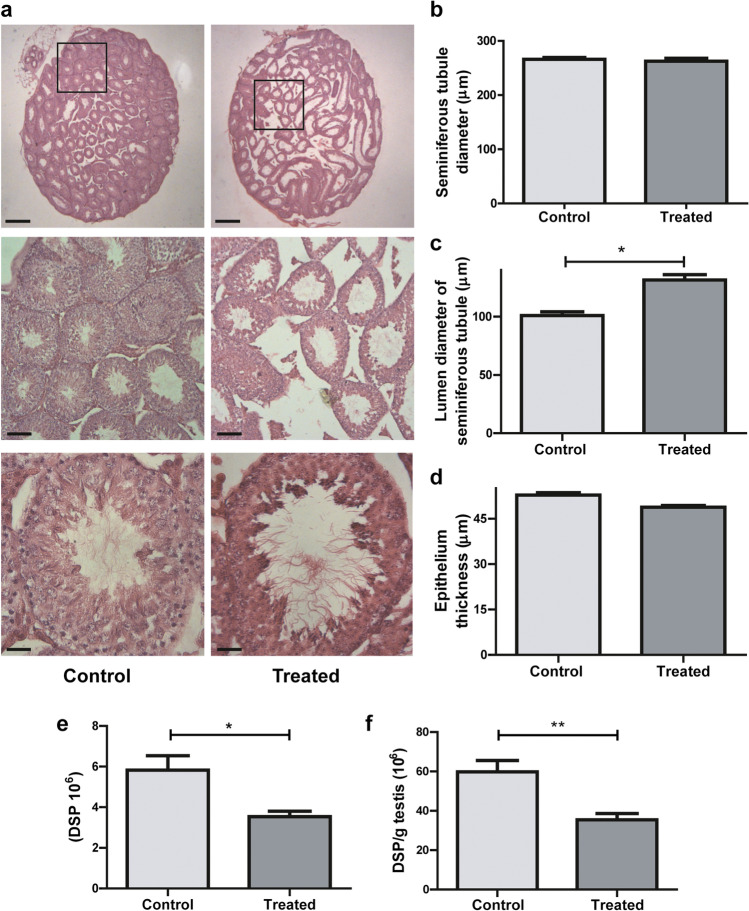
Fig. 2.
Testicular histology. a Cross-section images representative of testicular morphology in control (left panel) and treated (right panel) groups. Stained with Hematoxylin and Eosin. Original magnification of images: 20 × up, 100 × middle, 400 × down (scale bar: 500 μm, 100 μm and 25 μm, respectively). b–d Morphometric analysis of the testes: diameters of seminiferous tubules (b), their lumens (c), and the thickness of the seminiferous tubule epithelium (d). At least 50 tubules were evaluated for each male. n = 6 males per group with a minimum of 4 randomly selected fields per testis. Nested t test. *p < 0.05. Dates were transformed using the lognormal formula to assume normal distribution. e Daily sperm production per testis (DSP) and f efficiency (DSP per gram of testis) of sperm production in control and treated group, n = 5 males per group. Student’s t test *p < 0.05, **p < 0.01

