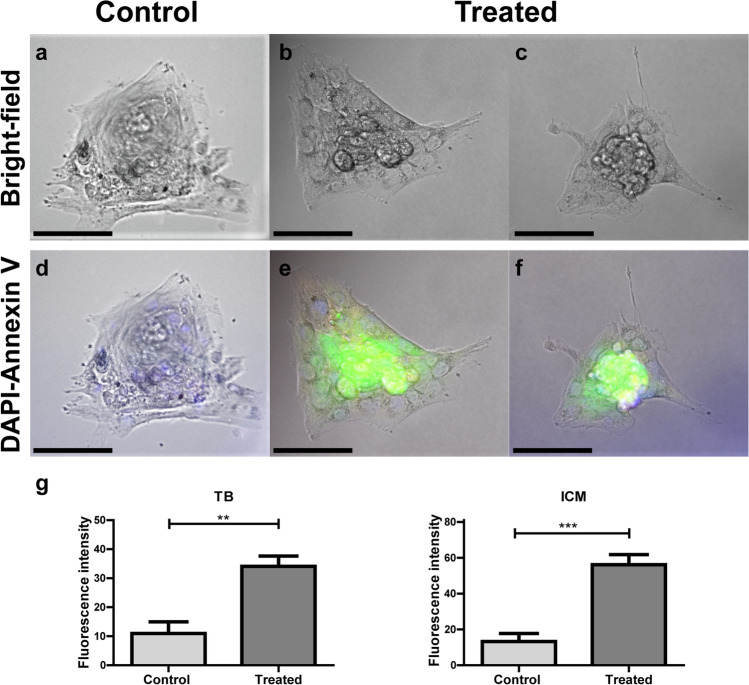
Fig. 5.
Cell death detection in two-cell embryos from control or treated groups cultured for 7 days. Embryos were labeled with annexin V-FITC (green) and DAPI (blue) and observed under an epifluorescence inverted microscope (Nikon Eclipse Ti-E). Bright field (a, b, and c) and fluorescence (d, e, and f) microscopic images. Scale bar, 100 μm. Trophoblast (TB) and inner cell mass (ICM) fluorescence intensities (g) are presented for control and treated groups. Original magnification 400 × , n = 3 males per group, 1–2 embryos from each

