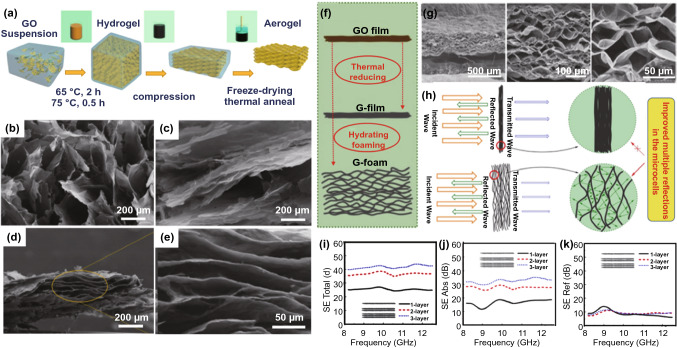
Fig. 4.
a Schematic illustration of the TGA fabrication procedure; SEM images of b TGA-C100%, c TGA-C40%, d, e TGA-C5% [126];
Copyright © 2020 American Chemical Society; f schematic representation of the fabrication process of G-film and G-foam; g SEM images showing microcellular structure in the cross section of G-foam; h schematic representation of multiple reflections in the microcellular structure of G-foam; i-k SET, SEA and SET of G-foam with different stacked layers in the frequency range of 8.2–12.5 GHz [100]. Copyright © 2016 Elsevier Ltd

