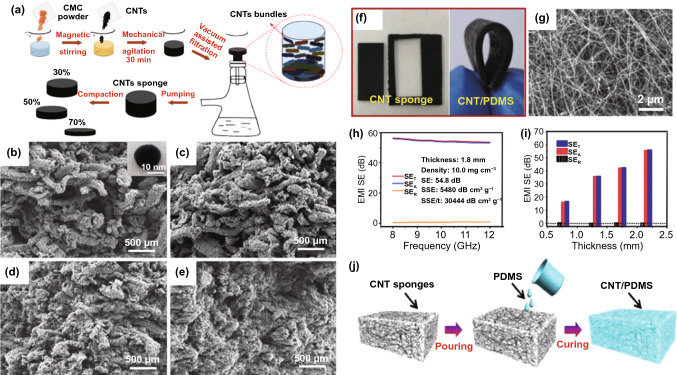
Fig. 7.
a Preparation process of composite CNT sponge with different compaction ratios. b-e SEM images of CNT sponges with varying compaction ratios [117].
Copyright © 2018 Elsevier Ltd. f Photograph of CNT sponges; g SEM image of the CNT sponge. h EMI SE of the CNT sponges in X-band. i Average SET, SER and SEA of CNT sponge with different thicknesses. j Schematic illustration of the fabrication of the CNT/PDMS nanocomposites [118]. Copyright © 2018 Elsevier Ltd

