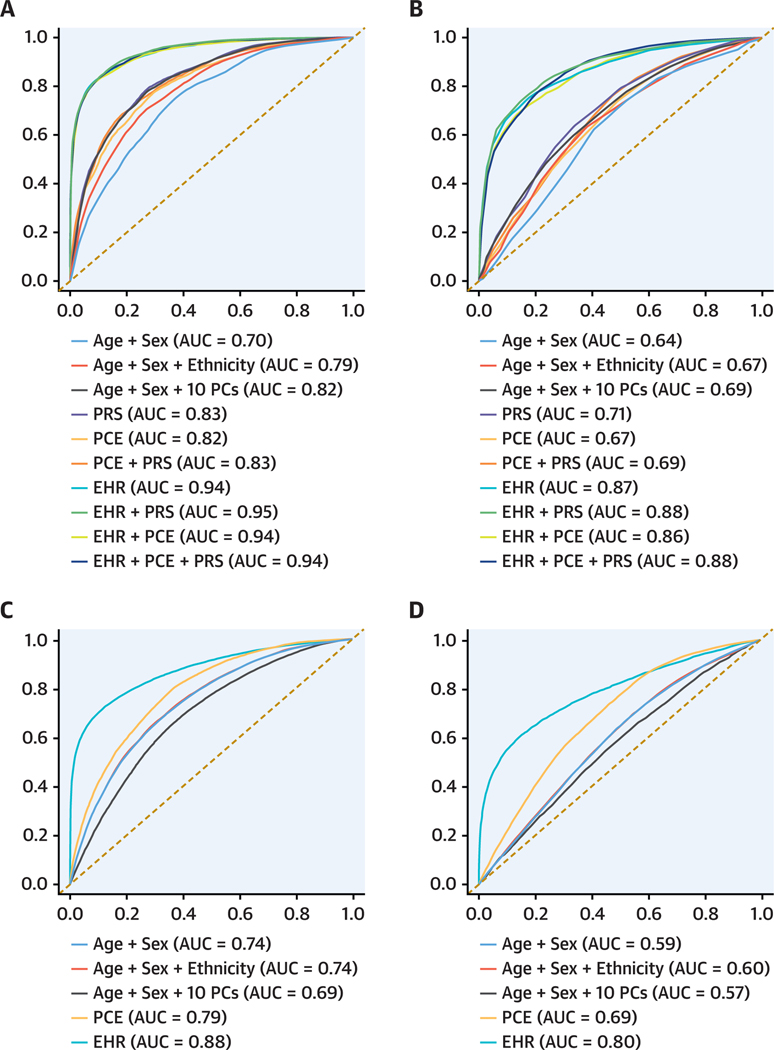
FIGURE 2.
Receiver-Operating Characteristic Curves for 1-Year CAD Risk Prediction Models The models were tested in BioMe (A), low-risk BioMe (B), UK Biobank (C), and low-risk UK Biobank (D) individuals. The y- and x-axes correspond to averaged true positive and false negative rates, respectively, across 100 iterations. The averaged area under the curve is indicated for every model. AUC = area under the curve; EHR = electronic health record; PC = principal component; PCE = pooled cohort equations; PRS = polygenic risk score.

