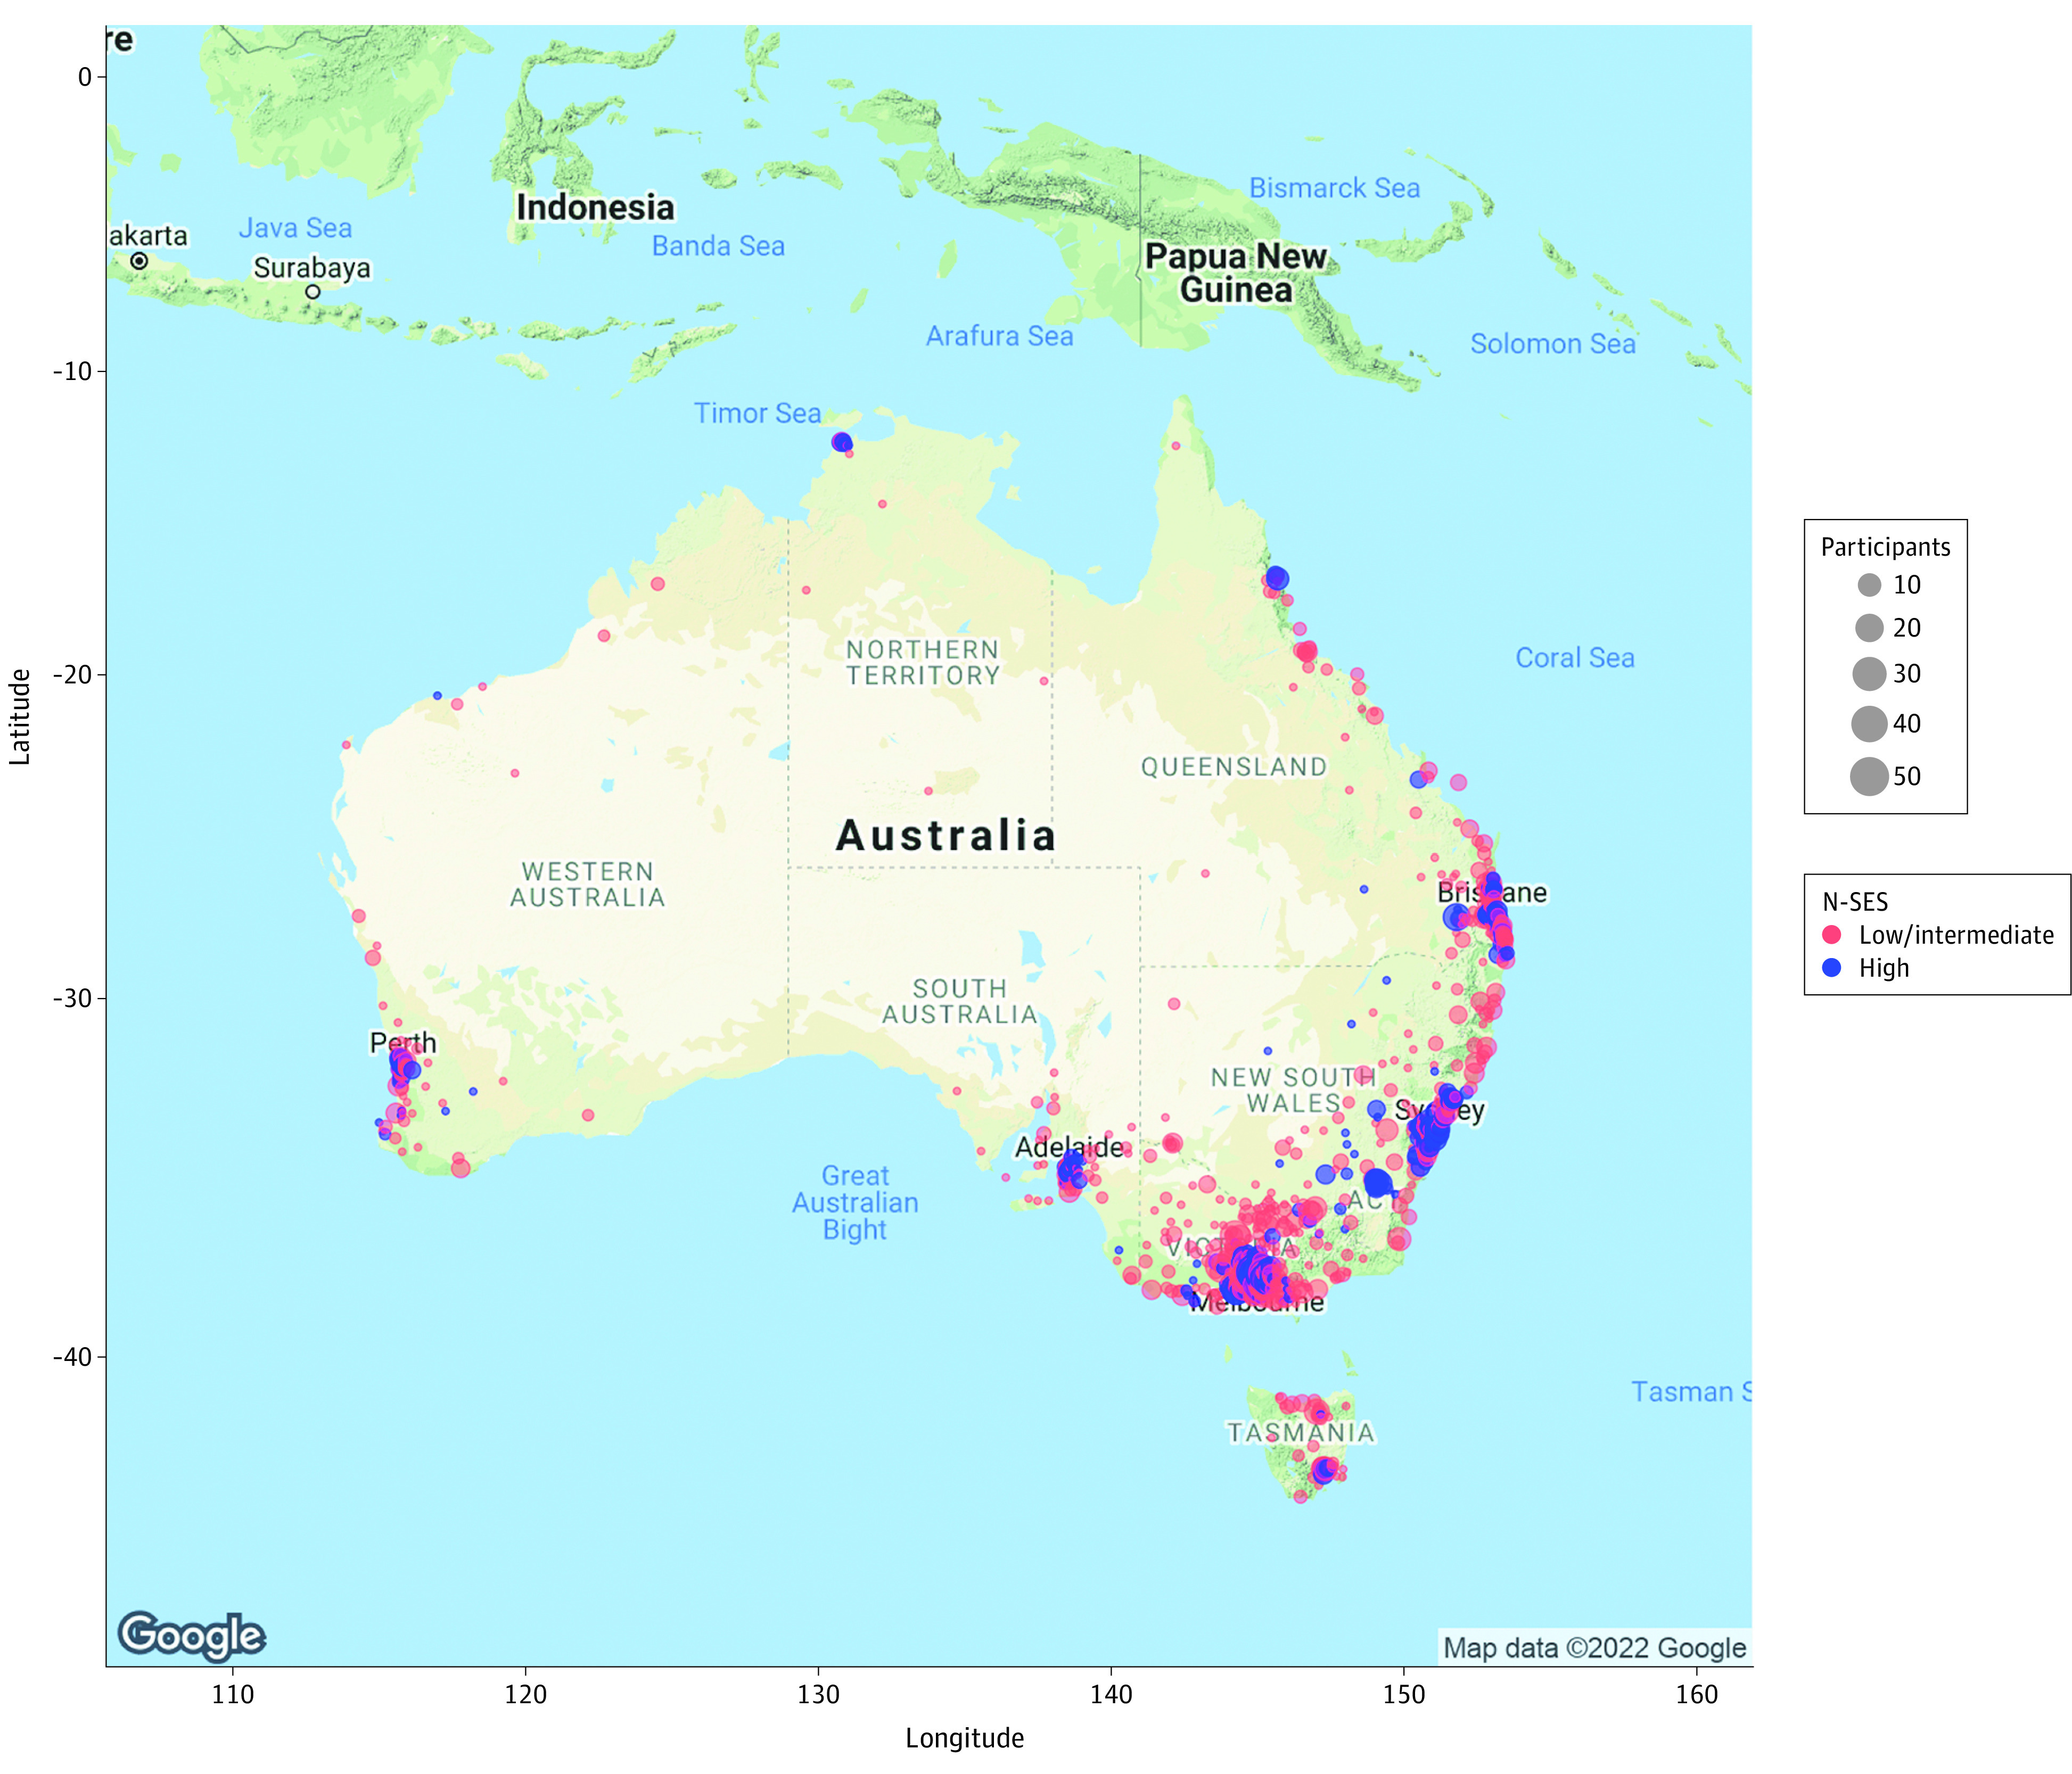
Figure 2. Geographic Distribution of Study Participants Across Australia by Neighborhood-Level Socioeconomic Status (N-SES).

Neighborhood-level socioeconomic status was measured using the Index of Relative Socio-economic Advantage and Disadvantage, with deciles 1 to 7 indicating low to intermediate N-SES and deciles 8 to 10 indicating high N-SES. Google Maps API services were used to generate the map image and attributed coordinates to participant postcodes using R software, version 1.2.5042 (R Foundation for Statistical Computing). Google Maps content is subject to the Google Maps/Google Earth additional terms of service38 and the Google privacy policy39 as of February 1, 2022.
